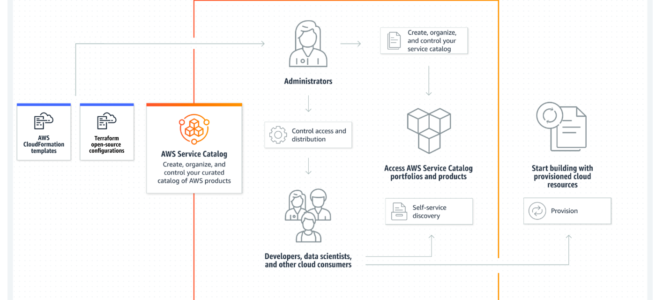
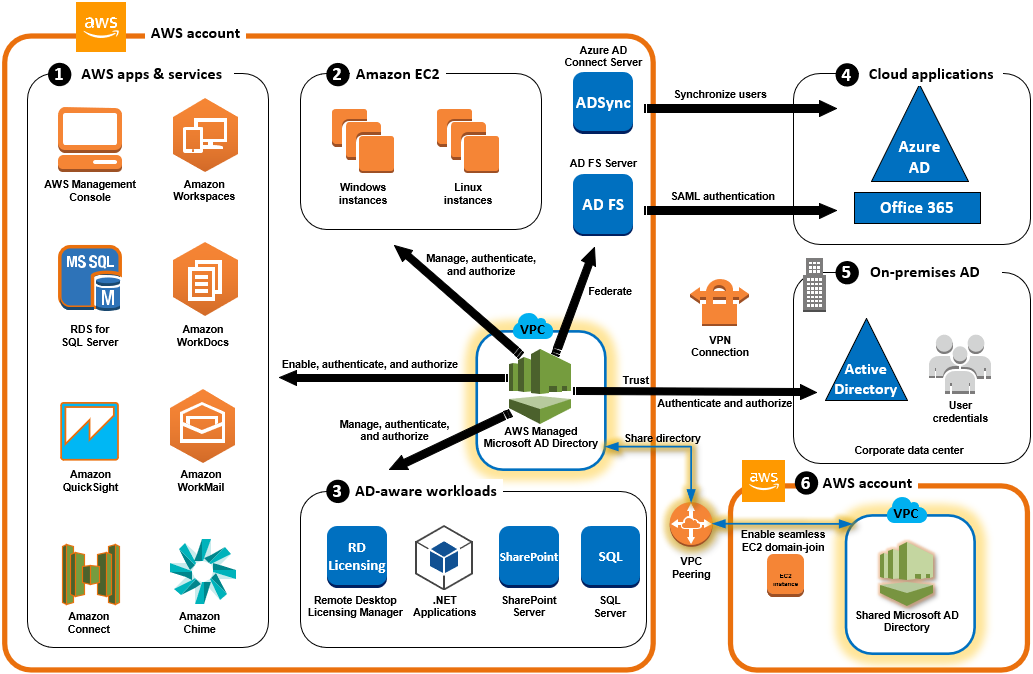
AWS Service Catalog helps centrally manage cloud resources to achieve governance at scale of the infrastructure as code (IaC) templates, written in CloudFormation, Terraform, or other IaC tools via External Engines.
allows IT administrators to create, manage, and distribute catalogs of approved products to end users, who can then access the products they need in a personalized portal.
can help control which users have access to each product to enforce compliance with organizational business policies while making sure the customers can quickly deploy the cloud resources they need.
increases agility and reduces costs as end users can find and launch only the products they need from a controlled catalog.
is a regional service and Portfolios and products are a regional construct that will need to be created per region and are only visible/usable on the regions in which they were created.
supports VPC Endpoints to privately access Service Catalog APIs from VPC without the need for an Internet gateway, NAT gateway, or VPN connection.
integrates with AWS Organizations for portfolio sharing across accounts, supporting delegated administrator capabilities.
Source: AWS
Service Catalog Portfolios and Products
Service Catalog portfolio is a collection of products, with configuration information that determines who can use those products and how they can use them.
Each Service Catalog product is based on an infrastructure-as-code (IaC) template using CloudFormation, Terraform, or External Engines.
Service Catalog supports three product types:
AWS CloudFormation – native support for CloudFormation templates
Terraform Cloud – integration with HashiCorp Terraform Cloud managed service
External – supports Terraform Community Edition (formerly Terraform Open Source) and other third-party IaC tools via self-managed provisioning engines
Customized portfolios can be created for each type of user in an organization and selectively granted access to the appropriate portfolio.
When an administrator adds a new version of a product to a portfolio, that version is automatically available to all current portfolio users.
Same product can be included in multiple portfolios.
Portfolios can be shared with other AWS accounts and extended by applying additional constraints.
Portfolio sharing supports account-to-account sharing, AWS Organizations sharing (to OUs or the entire organization), and deployment via CloudFormation StackSets.
Service Catalog Git-Synced Products
Service Catalog supports syncing products with IaC template files from external Git repositories including GitHub, GitHub Enterprise, and Bitbucket.
Git-synced products automatically update when changes are pushed to the connected repository, keeping products in sync with source control.
Uses AWS CodeConnections (formerly AWS CodeStar Connections, renamed March 2024) to establish and manage the connection between AWS and the external Git provider.
Enables Platform Engineers to streamline DevOps processes by keeping IaC templates in source control while automatically reflecting changes in Service Catalog.
Service Catalog uses the AWSServiceCatalogSyncServiceRolePolicy managed policy and the AWSServiceRoleForServiceCatalogSync service-linked role for sync operations.
Service Catalog External Engines
External Engines extend Service Catalog capabilities beyond native CloudFormation templates, enabling the use of other IaC tools.
The EXTERNAL product type replaced the previous “Terraform Open Source” product type (October 2023).
AWS Service Catalog no longer supports Terraform Open Source as a valid product type for any new products or provisioned products.
Existing Terraform Open Source products must be migrated to the External product type.
External engines require installing and configuring a provisioning engine in the Service Catalog administrator account (hub account).
Supports self-managed engines for governance, allowing organizations to use Terraform Community Edition, Pulumi, or other IaC tools with Service Catalog’s governance framework.
Service Catalog Access Control
Launch Constraint
provide AWS Service Catalog with the capability to perform actions on behalf of users even when those users do not have the necessary IAM permissions to perform those actions directly.
is an IAM Role that AWS Service Catalog assumes when an end user launches a product.
Service Catalog products without a launch constraint will launch and manage products using the end user’s IAM credentials; if the end user credentials are not sufficient for those activities, errors will result either in provisioning or in management activities.
supported for CloudFormation, Terraform Open Source (External), and Terraform Cloud product types.
Template Constraint
define rules that limit the parameter values that a user enters when launching a product
is applied when provisioning a new product or updating a product that is already in use.
applies the most restrictive constraint among all constraints applied to the portfolio and the product.
are not supported for Terraform/External or Terraform Cloud product types
Stack Set Constraint
allows configuring product deployment options using CloudFormation StackSets.
enables launching products as stack sets across multiple accounts and Regions.
a product can have either a launch constraint or a stack set constraint, but not both.
not supported for Terraform/External product types.
Notification Constraint
allows specifying an Amazon SNS topic to receive notifications about stack events.
not supported for Terraform Open Source or Terraform Cloud products.
TagOptions
TagOption library provides a centralized way to manage tags on provisioned resources.
allows administrators to define a set of key-value pairs that are applied to provisioned products.
resource tagging varies by account, so TagOptions are managed separately from portfolio product configurations.
Service Catalog Service Actions
Service actions enable end users to perform operational tasks, troubleshoot issues, run approved commands, or request permissions on provisioned products.
Eliminates the need to grant end users full access to AWS services.
Uses AWS Systems Manager (SSM) documents to define service actions.
Provides access to pre-defined actions that implement AWS best practices (e.g., EC2 stop and reboot) and custom actions.
Service actions are not available for Terraform/External or Terraform Cloud product types.
Service Catalog AppRegistry
Service Catalog AppRegistry allows organizations to understand the application context of their AWS resources.
AppRegistry provides a repository for the information that describes the applications and associated resources that you use within your enterprise.
AppRegistry provides a single, up-to-date definition of applications within their AWS environment.
Applications are defined with a name, description, associations to attribute groups (metadata), and associations to CloudFormation stacks (resources).
Attribute Groups support an open JSON schema, providing flexibility to capture enterprise metadata such as security classification, organizational ownership, cost center, and support information.
AppRegistry integrates with the myApplications dashboard in the AWS Management Console (launched November 2023), providing an application-centric view of key metrics including cost, health, security findings, and performance.
The awsApplication tag is automatically applied to associated resources, enabling application-level tracking across AWS services.
Supports Terraform-managed applications through the myApplications integration.
Service Catalog Integration with ITSM
AWS Service Management Connector previously provided integration with ServiceNow and Jira Service Management for provisioning Service Catalog products from ITSM tools.
Note: AWS Service Management Connector is no longer available to new customers as of March 31, 2026, and will reach end of support on March 31, 2027. Existing customers can continue using it until the end of support date.
AWS Certification Exam Practice Questions
Questions are collected from Internet and the answers are marked as per my knowledge and understanding (which might differ with yours).
AWS services are updated everyday and both the answers and questions might be outdated soon, so research accordingly.
AWS exam questions are not updated to keep up the pace with AWS updates, so even if the underlying feature has changed the question might not be updated
Open to further feedback, discussion and correction.
A company has several business units that want to use Amazon EC2. The company wants to require all business units to provision their EC2 instances by using only approved EC2 instance configurations. What should a SysOps administrator do to implement this requirement?
Create an EC2 instance launch configuration. Allow the business units to launch EC2 instances by specifying this launch configuration in the AWS Management Console.
Develop an IAM policy that limits the business units to provision EC2 instances only. Instruct the business units to launch instances by using an AWS CloudFormation template.
Publish a product and launch constraint role for EC2 instances by using AWS Service Catalog. Allow the business units to perform actions in AWS Service Catalog only.
Share an AWS CloudFormation template with the business units. Instruct the business units to pass a role to AWS CloudFormation to allow the service to manage EC2 instances.
A platform engineering team wants to ensure that all infrastructure deployments across the organization use approved Terraform configurations. The team wants developers to self-provision infrastructure without needing direct access to AWS services. Which approach meets these requirements?
Store Terraform configurations in an S3 bucket and grant developers read access to download and run them locally.
Create products using the External product type in AWS Service Catalog with a Terraform provisioning engine and grant developers access to the portfolio.
Create an IAM policy that allows developers to run terraform apply only with pre-approved configurations.
Use AWS CloudFormation to deploy Terraform configurations using custom resources.
A company wants to maintain a catalog of approved AWS resources that automatically stays in sync with their GitHub repository whenever templates are updated. Which Service Catalog feature should they use?
Create a Lambda function that triggers on GitHub webhooks to update Service Catalog products.
Use AWS CodePipeline to deploy updated templates to Service Catalog on each commit.
Use Service Catalog Git-synced products with AWS CodeConnections to sync products from the GitHub repository.
Manually upload new template versions to Service Catalog after each repository update.
An organization needs to track the cost, health, and security posture of their cloud applications from a single dashboard. They use Service Catalog AppRegistry to define their applications. Which AWS feature provides this consolidated application-level view?
AWS CloudWatch Application Insights
AWS Systems Manager Application Manager
myApplications dashboard in the AWS Management Console
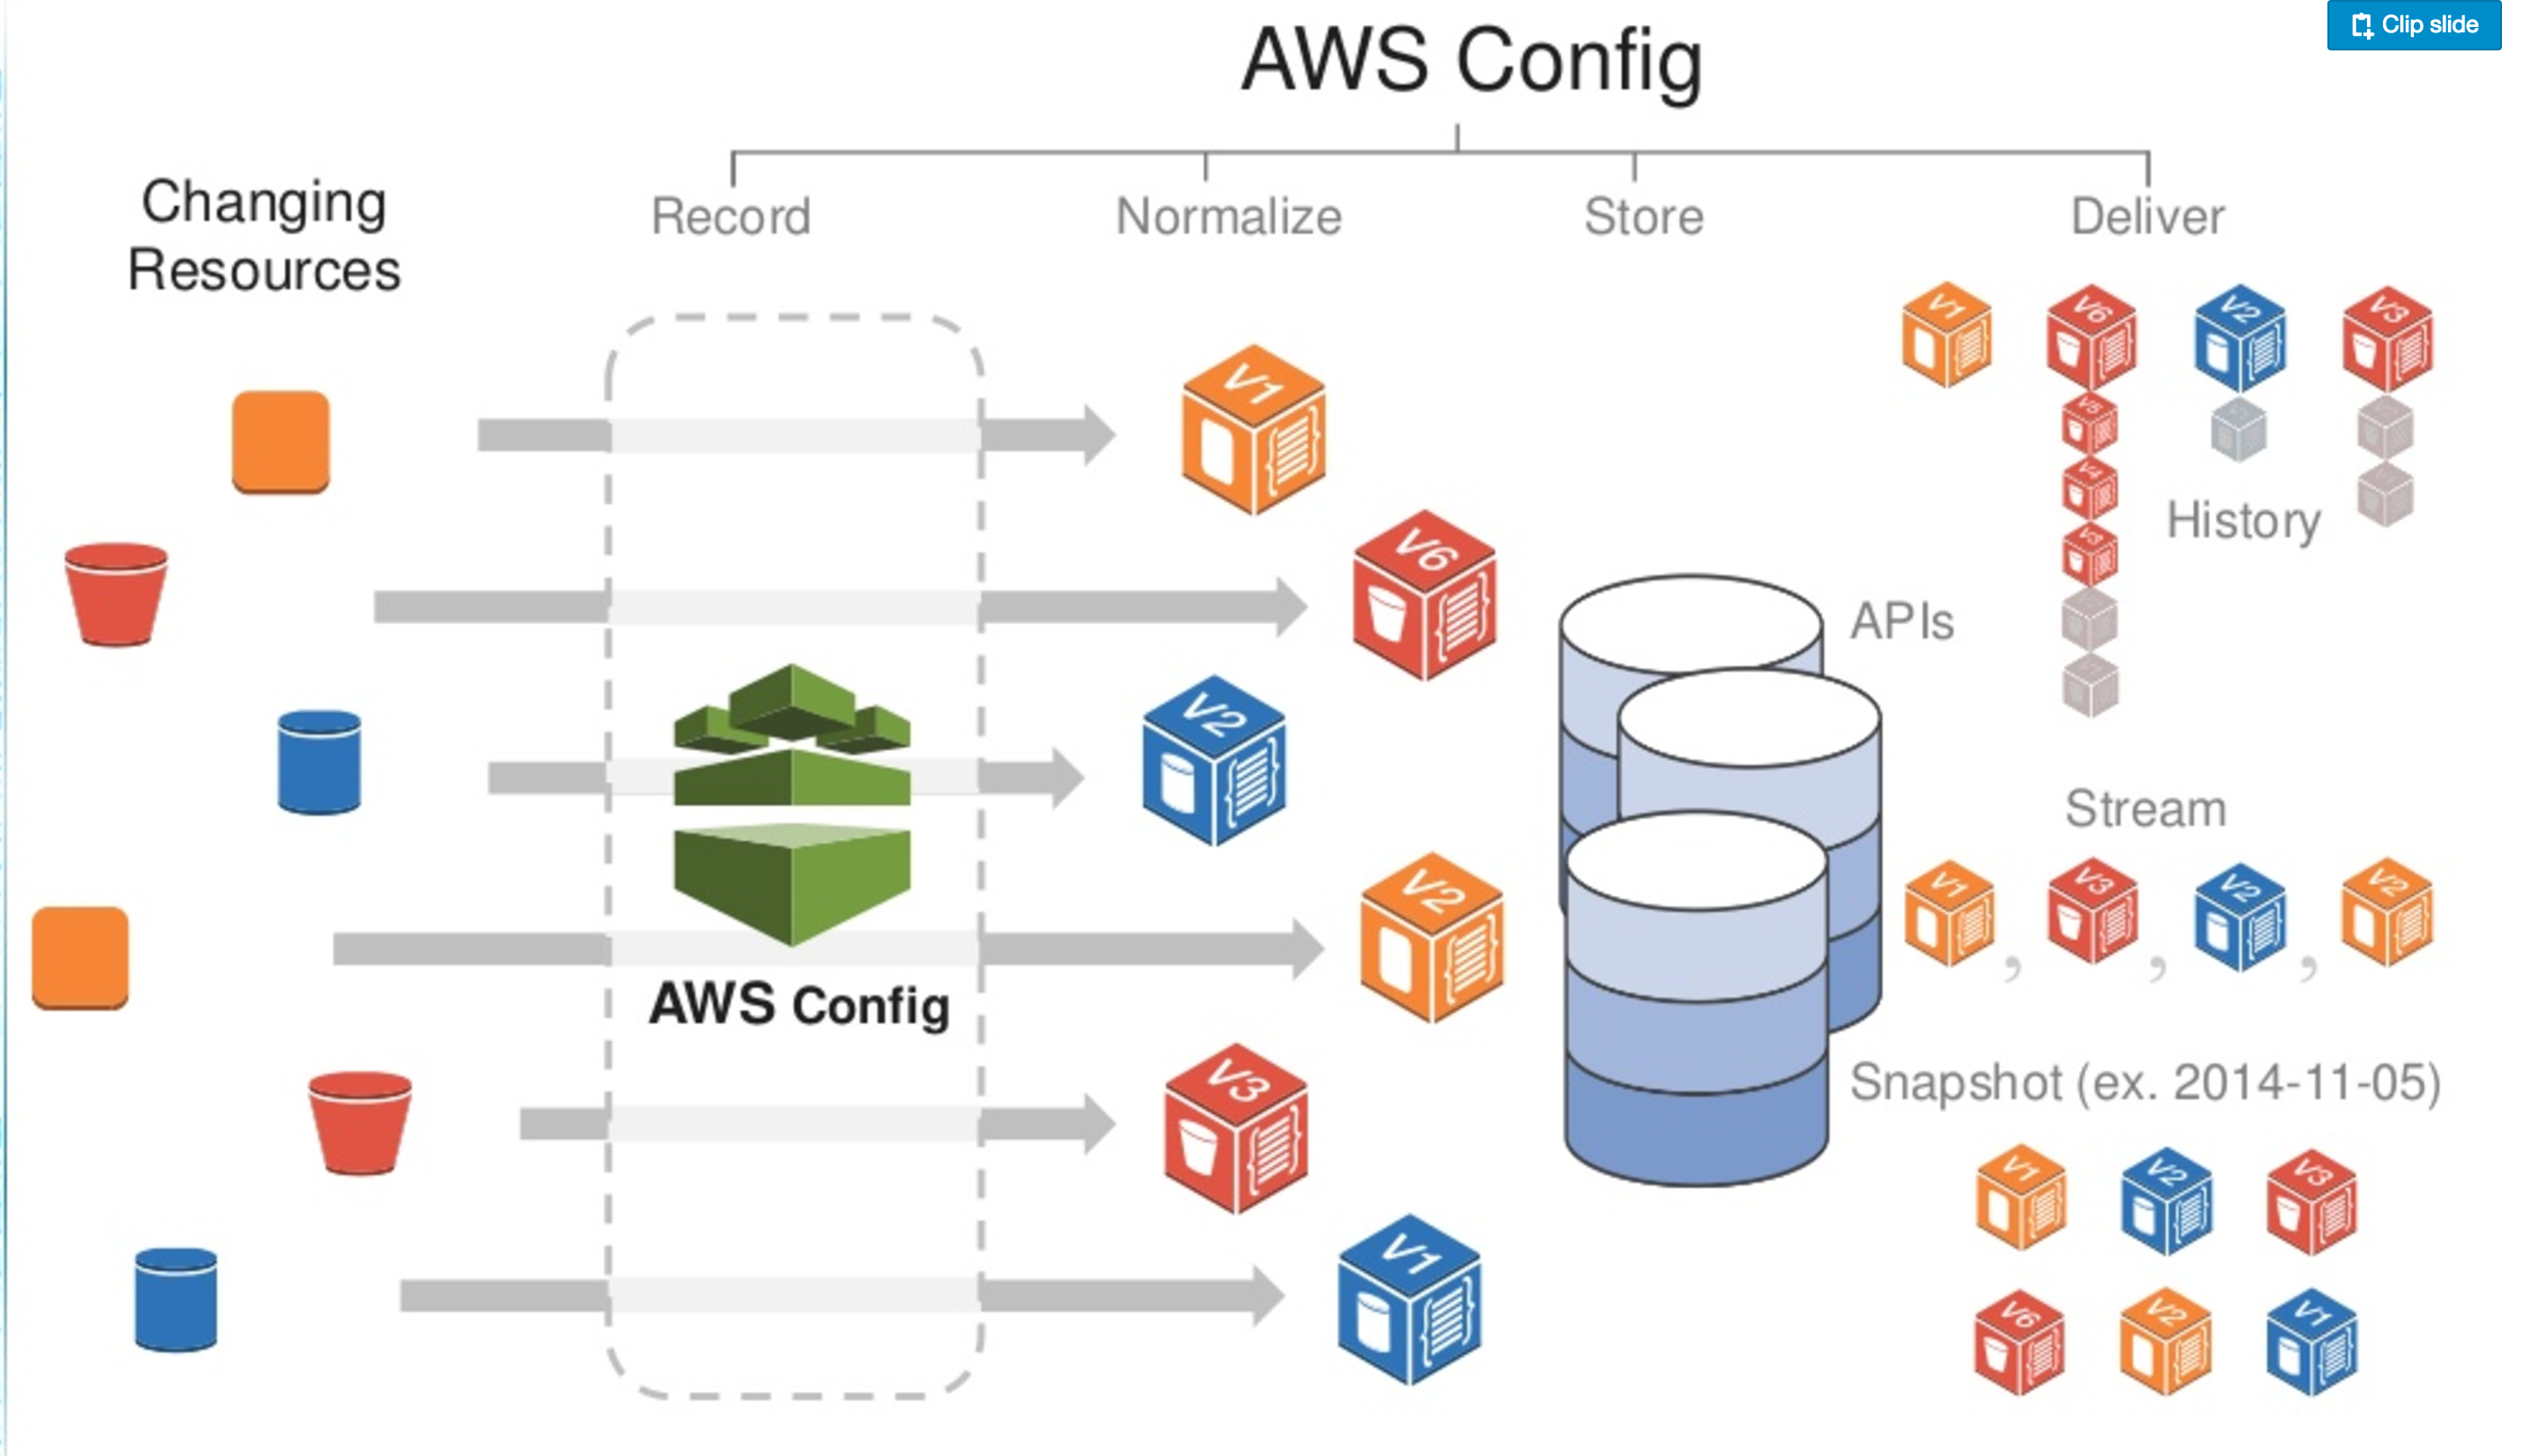
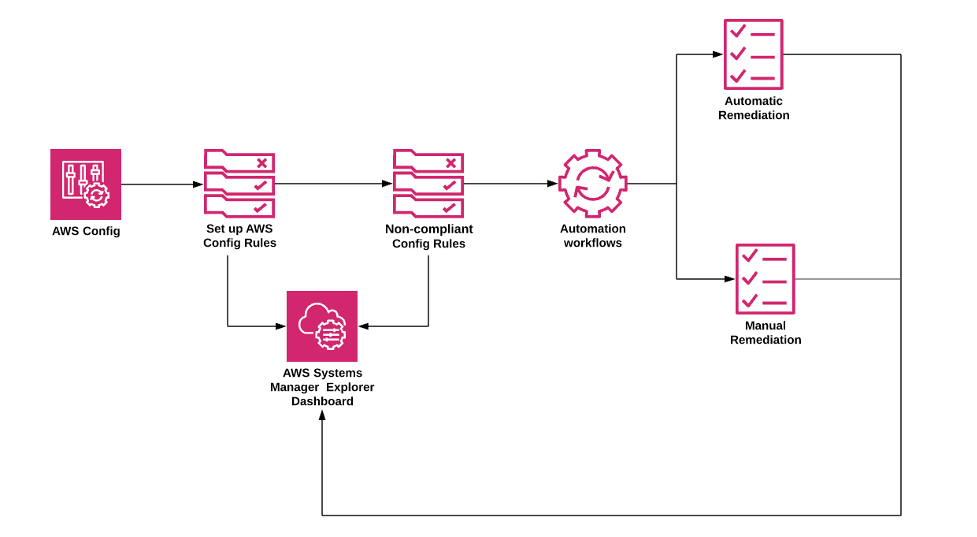
AWS Config is a fully managed service that provides AWS resource inventory, configuration history, and configuration change notifications to enable security, compliance, and governance.
provides a detailed view of the configuration of AWS resources in the AWS account.
is a regional service.
is strictly a detective service and does not prevent changes but it integrates with other AWS services for remediation.
gives point-in-time and historical states thereby allowing users to see changes visually in a timeline.
will only record the latest configuration of that resource only, in cases where several configuration changes are made to a resource in quick succession (i.e., within a span of a few minutes); this represents the cumulative impact of that entire set of changes.
supports over 380 AWS resource types across services including EC2, S3, RDS, Lambda, EKS, Bedrock, SageMaker, IoT, and many more, with continuous expansion.
provides customizable, predefined rules (managed rules) as well as the ability to define custom rules using Lambda functions or AWS CloudFormation Guard DSL.
can help with the following:
Evaluate the AWS resource configurations for desired settings.
Get a snapshot of the current configurations of the supported resources that are associated with your AWS account.
Retrieve configurations of one or more resources that exist in the account.
Retrieve historical configurations of one or more resources.
Receive a notification whenever a resource is created, modified, or deleted.
View relationships between resources e.g., you might want to find all resources that use a particular security group.
Query the current configuration state of resources using SQL-like advanced queries.
AWS Config Use Cases
Security Analysis & Resource Administration
enables continuous monitoring and governance over resource configurations and helps evaluate them for any misconfigurations leading to security gaps or weaknesses.
Auditing & Compliance
helps maintain a complete inventory of all resources and their configurations attributes as well as point in time history
helps retrieve historical configurations that can be very useful to ensure compliance and audits with internal policies and best practices
Change Management
helps understand relationships between resources so that the impact of the change can be proactively assessed.
can be configured to notify whenever resources are created, modified, or deleted without having to monitor these changes by polling the calls made to each resource
Troubleshooting
helps to quickly identify and troubleshoot issues, by being able to use the historical configurations and compare the last working configuration to the one recent change causing issues.
Discovery
helps discover resources that exist within an account leading to better inventory and asset management.
Get a snapshot of the current configurations of the supported resources that are associated with the AWS account
Proactive Compliance
evaluates resource configurations before provisioning using proactive rules, preventing non-compliant resources from being created.
integrates with CloudFormation Hooks to block deployments that would violate compliance requirements.
AWS Config Concepts
AWS Resources
AWS Resources are entities created and managed for e.g. EC2 instances, Security groups
Resource Relationship
AWS Config discovers AWS resources in the account and then creates a map of relationships between AWS resources for e.g. EBS volume linked to an EC2 instance
Configuration Items
A configuration item represents a point-in-time view of the supported AWS resource
Components of a configuration item include metadata, attributes, relationships, current configuration, and related events.
Configuration Snapshot
A configuration snapshot is a collection of the configuration items for the supported resources that exist in the account.
Configuration History
A configuration history is a collection of the configuration items for a given resource over any time period.
Configuration Stream
Configuration stream is an automatically updated list of all configuration items for the resources that AWS Config is recording.
Configuration Recorder
Configuration recorder stores the configurations of the supported resources in your account as configuration items.
A configuration recorder needs to be created and started for recording and by default records, all supported services in the region.
Supports two recording frequencies:
Continuous recording – records configuration changes continuously whenever a change occurs (default).
Daily recording (Periodic) – captures the latest configuration changes once every 24 hours, reducing the number of configuration items recorded and costs.
Recording frequency can be configured at the resource type level, allowing a mix of continuous and daily recording.
AWS Config Rules
AWS Config Rules help define desired configuration settings for specific resources or for the entire account.
AWS Config continuously tracks the resource configuration changes against the rules and if violated marks the resource as non-compliant.
can be triggered either periodically or on configuration changes.
supports organizational rules that can be deployed across all accounts in an AWS Organization.
Conformance Packs
A conformance pack is a collection of AWS Config rules and remediation actions that can be deployed as a single entity.
helps manage compliance using a common framework and packaging model across an organization.
can be deployed across an entire organization using AWS Organizations integration.
supports sample conformance packs for common compliance frameworks like PCI-DSS, HIPAA, NIST, and CIS Benchmarks.
Advanced Queries
provides a SQL-based querying interface to retrieve resource configuration metadata and compliance state.
supports single account/region or multi-account/multi-region queries via configuration aggregators.
useful for inventory management, operational intelligence, security, and compliance reporting.
AWS Config Flow
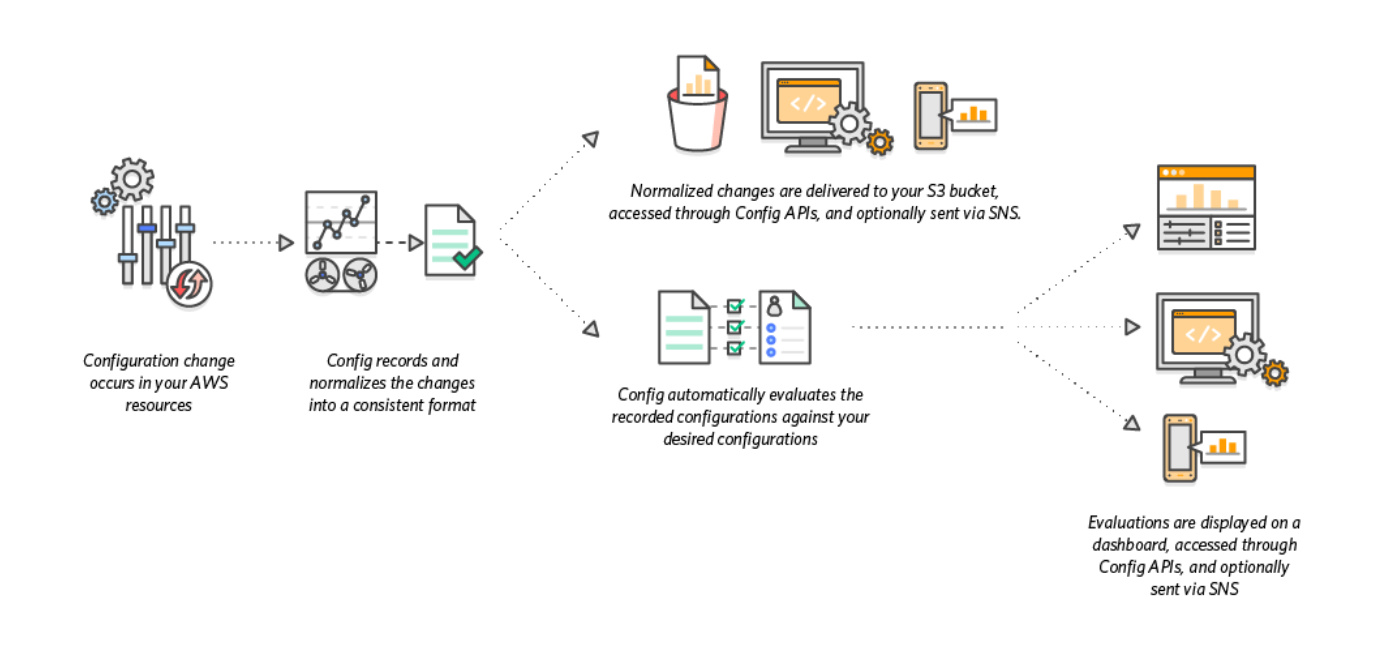
When AWS Config is turned on, it discovers the supported resources that exist in the account and generates a configuration item for each resource.
By default, AWS Config creates configuration items for every supported resource in the region but can be customized to limited resource types.
AWS Config
generates configuration items when the configuration of a resource changes, and it maintains historical records of the configuration items of the resources from the time the configuration recorder is started.
keeps track of all changes to the resources by invoking the Describe or the List API call for each resource as well as related resources in the account.
also tracks the configuration changes that were not initiated by the API. It examines the resource configurations periodically and generates configuration items for the configurations that have changed.
Configuration items are delivered in a configuration stream to an S3 bucket.
AWS Config rules, if configured,
are evaluated continuously for resource configurations for desired settings.
resources are evaluated either in response to configuration changes or periodically, depending on the rule.
when the resources are evaluated, it invokes the rule’s AWS Lambda function (for custom Lambda rules), or evaluates using Guard DSL (for custom policy rules), which contains the evaluation logic for the rule.
The function returns the compliance status of the evaluated resources.
If a resource violates the conditions of a rule, the resource and the rule are flagged as non-compliant and a notification is sent to the SNS topic.
AWS Config Rules Types
AWS Managed Rules
Predefined, customizable rules provided by AWS to evaluate common compliance scenarios.
AWS has significantly expanded managed rules – adding 42 rules (Nov 2025), 13 rules (Jan 2026), and 75 rules (Feb 2026) for security, cost, durability, and operations use cases.
Cover categories including security, cost optimization, durability, performance, and operations.
Custom Lambda Rules
Rules with evaluation logic defined in an AWS Lambda function.
Provides flexibility for complex evaluation scenarios requiring custom code.
Custom Policy Rules (Guard DSL)
Rules defined using AWS CloudFormation Guard, an open-source, policy-as-code domain-specific language (DSL).
Does not require a Lambda function, reducing operational overhead and cost.
Supports both proactive and detective evaluation modes.
Rules written in the Guard DSL validate JSON/YAML-formatted configuration data.
Evaluation Modes
Detective evaluation – evaluates resources after they have been provisioned (traditional mode).
Proactive evaluation – evaluates resource configurations before provisioning, allowing you to check compliance before deployment.
Proactive rules integrate with CloudFormation Hooks to prevent non-compliant resources from being created.
AWS Config Remediation
AWS Config is strictly a detective service and does not prevent changes but it integrates with other AWS services for remediation.
allows remediation of noncompliant resources that are evaluated by config rules.
Remediation is applied using Systems Manager Automation documents, which define the actions to be performed on noncompliant AWS resources.
provides a set of managed automation documents with remediation actions.
Custom automation documents can also be created and associated with rules.
supports two remediation modes:
Manual remediation – allows you to select noncompliant resources and trigger remediation manually.
Automatic remediation – automatically triggers remediation when a resource is found non-compliant, with configurable retry attempts and wait time.
Service-Linked Recorder
AWS Config introduced the service-linked recorder (Dec 2024), a new type of AWS Config recorder managed by an AWS service.
Service-linked recorders can record configuration data on service-specific resources on behalf of other AWS services.
Operate independently of any existing customer-managed AWS Config recorder.
Are immutable to ensure consistency, prevention of configuration drift, and simplified experience.
Allow you to independently manage your AWS Config recorder while authorized AWS services manage the service-linked recorder for feature-specific requirements.
Example: Amazon CloudWatch uses a service-linked recorder to provide centralized visibility into AWS service telemetry configurations (VPC Flow Logs, EC2 Detailed Metrics, Lambda Traces).
Available at no additional cost from AWS Config to customers.
Internal Service-Linked Rules
AWS Config now supports internal service-linked rules (Jun 2026), enabling AWS services to evaluate resource configurations using Config managed rules.
Extends the service-linked recorder capability by allowing AWS services like AWS Security Hub CSPM to deploy and manage rule evaluations.
Evaluation results are delivered directly to the AWS service that deployed the rule at no charge from AWS Config to customers.
Operate independently of existing customer-managed AWS Config recorders and rules.
Allows customers to continue using AWS Config for inventory, governance, compliance, and auditing while AWS services independently manage service-specific evaluations.
Multi-Account Multi-Region Data Aggregation
An aggregator helps collect AWS Config configuration and compliance data from the following:
Multiple accounts and multiple regions.
Single account and multiple regions.
An organization in AWS Organizations and all the accounts in that organization that has AWS Config enabled.
Aggregators support advanced queries across multiple accounts and regions for centralized compliance reporting.
A delegated administrator account can be designated to manage AWS Config rules and conformance packs across the organization.
AWS Config Pricing
Charged based on:
Configuration items recorded – $0.003 per item for continuous recording, $0.012 per item for periodic (daily) recording.
Config rule evaluations – charged per rule evaluation in the account.
Conformance pack evaluations – charged per rule evaluation within a conformance pack.
Additional costs for S3 storage (for configuration snapshots/history) and SNS notifications.
Service-linked recorders and internal service-linked rules are available at no additional AWS Config cost.
Periodic (daily) recording can significantly reduce costs for resources that change frequently but don’t require real-time visibility.
AWS Config reports on WHAT has changed, whereas CloudTrail reports on WHO made the change, WHEN, and from WHICH location.
AWS Config focuses on the configuration of the AWS resources and reports with detailed snapshots on HOW the resources have changed, whereas CloudTrail focuses on the events or API calls, that drive those changes. It focuses on the user, application, and activity performed on the system.
AWS Config is resource-centric (tracks configuration state), CloudTrail is event-centric (tracks API activity).
Both services complement each other – Config shows the desired vs. actual state; CloudTrail shows who/when the change was made.
AWS Certification Exam Practice Questions
Questions are collected from Internet and the answers are marked as per my knowledge and understanding (which might differ with yours).
AWS services are updated everyday and both the answers and questions might be outdated soon, so research accordingly.
AWS exam questions are not updated to keep up the pace with AWS updates, so even if the underlying feature has changed the question might not be updated
Open to further feedback, discussion and correction.
One of the challenges in managing AWS resources is to keep track of changes in the resource configuration over time. Which one of the following statements provide the best solution?
Use strict syntax tagging on the resources
Create a custom application to automate the configuration management process
Use AWS Config for supported services and use an automated process via APIs for unsupported services
Use resource groups and tagging along with CloudTrail so that you can audit changes using the logs
Fill the blanks: ____ helps us track AWS API calls and transitions, ____ helps to understand what resources we have now, and ____ allows auditing credentials and logins.
AWS Config, CloudTrail, IAM Credential Reports
CloudTrail, IAM Credential Reports, AWS Config
CloudTrail, AWS Config, IAM Credential Reports
AWS Config, IAM Credential Reports, CloudTrail
A company needs to evaluate resource configurations BEFORE deploying them to production to prevent non-compliant resources from being created. Which AWS Config feature should they use?
Detective evaluation with managed rules
Proactive evaluation with proactive rules
Conformance packs with auto-remediation
Advanced queries with SQL syntax
A company wants to reduce AWS Config costs for resources that change frequently but don’t require real-time monitoring. Which approach should they use?
Disable the configuration recorder for those resources
Use advanced queries instead of rules
Configure daily (periodic) recording for those resource types
Use conformance packs instead of individual rules
An organization wants to define compliance rules without using Lambda functions to reduce operational overhead. Which AWS Config rule type should they use?
AWS Managed Rules
Custom Lambda Rules
Custom Policy Rules using AWS CloudFormation Guard DSL
Organizational Rules with Systems Manager
A company needs to deploy a collection of compliance rules and remediation actions across all accounts in their AWS Organization as a single entity. Which AWS Config feature should they use?
Multi-account aggregator
Organizational managed rules
Conformance packs deployed via AWS Organizations
Service-linked rules
An AWS service needs to independently evaluate resource configurations without impacting a customer’s existing AWS Config setup. Which feature enables this?
Conformance packs
Organizational rules
Multi-account aggregator
Internal service-linked rules with service-linked recorder
AWS CloudFormation gives developers and systems administrators an easy way to create and manage a collection of related AWS resources, provision and update them in an orderly and predictable fashion.
CloudFormation consists of
Template
is an architectural diagram and provides logical resources
a JSON or YAML-format, text-based file that describes all the AWS resources needed to deploy and run the application.
Stack
is the end result of that diagram and provisions physical resources mapped to the logical resources.
is the set of AWS resources that are created and managed as a single unit when CloudFormation instantiates a template.
CloudFormation template can be used to set up the resources consistently and repeatedly over and over across multiple regions.
Resources can be updated, deleted, and modified in a controlled and predictable way, in effect applying version control to the infrastructure as done for software code
AWS CloudFormation Template consists of elements:-
List of AWS resources and their configuration values
An optional template file format version number
An optional list of template parameters (input values supplied at stack creation time)
An optional list of output values like public IP address using the Fn:GetAtt function
An optional list of data tables used to lookup static configuration values for e.g., AMI names per AZ
CloudFormation supports Chef & Puppet Integration to deploy and configure right down the application layer
CloudFormation provides a set of application bootstrapping scripts that enable you to install packages, files, and services on the EC2 instances by simply describing them in the CloudFormation template
By default, automatic rollback on error feature is enabled, which will cause all the AWS resources that CloudFormation created successfully for a stack up to the point where an error occurred to be deleted.
CloudFormation supports Optimistic Stabilization (2024) delivering up to 40% faster stack creation times by beginning parallel creation of dependent resources once a dependency reaches CONFIGURATION_COMPLETE state.
CloudFormation supports Early Validation that validates templates during change set creation, catching invalid property syntax and resource name conflicts before resource provisioning begins.
In case of automatic rollback, charges would still be applied for the resources, the time they were up and running
CloudFormation provides a WaitCondition resource that acts as a barrier, blocking the creation of other resources until a completion signal is received from an external source e.g. application or management system
CloudFormation allows deletion policies to be defined for resources in the template for e.g. resources to be retained or snapshots can be created before deletion useful for preserving S3 buckets when the stack is deleted
AWS CloudFormation Concepts
AWS CloudFormation, you work with templates and stacks
Templates
act as blueprints for building AWS resources.
is a JSON or YAML formatted text file, saved with any extension, such as .json, .yaml, .template, or .txt.
have additional capabilities to build complex sets of resources and reuse those templates in multiple contexts for e.g. using input parameters to create generic and reusable templates
Name used for a resource within the template is a logical name but when CloudFormation creates the resource, it generates a physical name that is based on the combination of the logical name, the stack name, and a unique ID
Stacks
Stacks manage related resources as a single unit,
Collection of resources can be created, updated, and deleted by creating, updating, and deleting stacks.
All the resources in a stack are defined by the stack’s AWS CloudFormation template
CloudFormation makes underlying service calls to AWS to provision and configure the resources in the stack and can perform only actions that the users have permission to do.
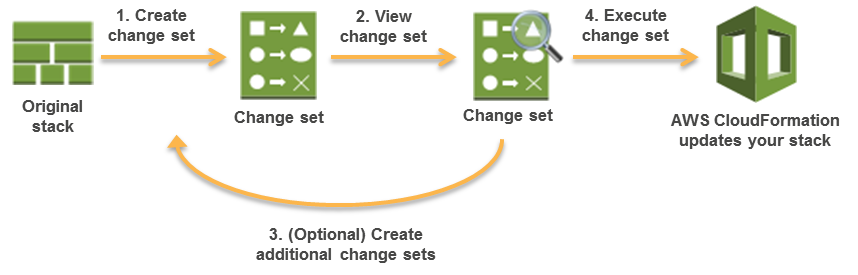
Change Sets
Change Sets presents a summary or preview of the proposed changes that CloudFormation will make when a stack is updated.
Change Sets help check how the changes might impact running resources, especially critical resources, before implementing them.
CloudFormation makes the changes to the stack only when the change set is executed, allowing you to decide whether to proceed with the proposed changes or explore other changes by creating another change set.
Change sets don’t indicate whether AWS CloudFormation will successfully update a stack for e.g. if account limits are hit or the user does not have permission.
Custom Resources
Custom resources help write custom provisioning logic in templates that CloudFormation runs anytime the stacks are created, updated, or deleted.
Custom resources help include resources that aren’t available as AWS CloudFormation resource types and can still be managed in a single stack.
Custom resources support a ServiceTimeout property (2024) allowing custom timeout values instead of the fixed one-hour timeout, accelerating development feedback loops.
AWS recommends using CloudFormation Registry instead.
Nested Stacks
Nested stacks are stacks created as part of other stacks.
A nested stack can be created within another stack by using the AWS::CloudFormation::Stack resource.
Nested stacks can be used to define common, repeated patterns and components and create dedicated templates which then can be called from other stacks.
Root stack is the top-level stack to which all the nested stacks ultimately belong. Nested stacks can themselves contain other nested stacks, resulting in a hierarchy of stacks.
In addition, each nested stack has an immediate parent stack. For the first level of nested stacks, the root stack is also the parent stack.
Certain stack operations, such as stack updates, should be initiated from the root stack rather than performed directly on nested stacks themselves.
Drift Detection
Drift detection enables you to detect whether a stack’s actual configuration differs, or has drifted, from its expected configuration.
Drift detection help identify stack resources to which configuration changes have been made outside of CloudFormation management
Drift detection can detect drift on an entire stack or individual resources
Corrective action can be taken to make sure the stack resources are again in sync with the definitions in the stack template, such as updating the drifted resources directly so that they agree with their template definition
Resolving drift helps to ensure configuration consistency and successful stack operations.
CloudFormation detects drift on those AWS resources that support drift detection. Resources that don’t support drift detection are assigned a drift status of NOT_CHECKED.
Drift detection can be performed on stacks with the following statuses: CREATE_COMPLETE, UPDATE_COMPLETE, UPDATE_ROLLBACK_COMPLETE, and UPDATE_ROLLBACK_FAILED.
CloudFormation does not detect drift on any nested stacks that belong to that stack. Instead, you can initiate a drift detection operation directly on the nested stack.
CloudFormation Template Anatomy
Resources (required)
Specifies the stack resources and their properties, such as an EC2 instance or an S3 bucket that would be created.
Resources can be referred to in the Resources and Outputs sections
Parameters (optional)
Pass values to the template at runtime (during stack creation or update)
Parameters can be referred from the Resources and Outputs sections
Can be referred using Fn::Ref or !Ref
Mappings (optional)
A mapping of keys and associated values that used to specify conditional parameter values, similar to a lookup table.
Can be referred using Fn::FindInMap or !FindInMap
Outputs (optional)
Describes the values that are returned whenever you view your stack’s properties.
Format Version (optional)
AWS CloudFormation template version that the template conforms to.
Description (optional)
A text string that describes the template. This section must always follow the template format version section.
Metadata (optional)
Objects that provide additional information about the template.
Rules (optional)
Validates a parameter or a combination of parameters passed to a template during stack creation or stack update.
Conditions (optional)
Conditions control whether certain resources are created or whether certain resource properties are assigned a value during stack creation or update.
Transform (optional)
For serverless applications (also referred to as Lambda-based applications), specifies the version of the AWS Serverless Application Model (AWS SAM) to use.
When you specify a transform, you can use AWS SAM syntax to declare resources in the template. The model defines the syntax that you can use and how it’s processed.
CloudFormation Access Control
IAM
IAM can be applied with CloudFormation to access control for users whether they can view stack templates, create stacks, or delete stacks
IAM permissions need to be provided for the user to the AWS services and resources provisioned when the stack is created
Before a stack is created, AWS CloudFormation validates the template to check for IAM resources that it might create
Service Role
A service role is an AWS IAM role that allows AWS CloudFormation to make calls to resources in a stack on the user’s behalf
By default, AWS CloudFormation uses a temporary session that it generates from the user credentials for stack operations.
For a service role, AWS CloudFormation uses the role’s credentials.
When a service role is specified, AWS CloudFormation always uses that role for all operations that are performed on that stack.
Template Resource Attributes
CreationPolicy Attribute
is invoked during the associated resource creation.
can be associated with a resource to prevent its status from reaching create complete until CloudFormation receives a specified number of success signals or the timeout period is exceeded.
helps to wait on resource configuration actions before stack creation proceeds for e.g. software installation on an EC2 instance
DeletionPolicy Attribute
preserve or (in some cases) backup a resource when its stack is deleted
CloudFormation deletes the resource if a resource has no DeletionPolicy attribute, by default.
To keep a resource when its stack is deleted,
default, Delete where the resources would be deleted.
specify Retain for that resource, to prevent deletion.
specify Snapshot to create a snapshot before deleting the resource, if the snapshot capability is supported e.g. RDS, EC2 volume, etc.
DependsOn Attribute
helps determine dependency order and specify that the creation of a specific resource follows another.
the resource is created only after the creation of the resource specified in the DependsOn attribute.
Metadata Attribute
enables association of structured data with a resource
UpdatePolicy Attribute
Defines how AWS CloudFormation handles updates to the resources
For AWS::AutoScaling::AutoScalingGroup resources, CloudFormation invokes one of three update policies depending on the type of change or whether a scheduled action is associated with the Auto Scaling group.
The AutoScalingReplacingUpdate and AutoScalingRollingUpdate policies apply only when you do one or more of the following:
Change the Auto Scaling group’s AWS::AutoScaling::LaunchConfiguration
Change the Auto Scaling group’s VPCZoneIdentifier property
Change the Auto Scaling group’s LaunchTemplate property
Update an Auto Scaling group that contains instances that don’t match the current LaunchConfiguration.
The AutoScalingScheduledAction policy applies when you update a stack that includes an Auto Scaling group with an associated scheduled action.
For AWS::Lambda::Alias resources, CloudFormation performs a CodeDeploy deployment when the version changes on the alias.
CloudFormation Termination Protection
Termination protection helps prevent a stack from being accidentally deleted.
Termination protection on stacks is disabled by default.
Termination protection can be enabled on a stack creation
Termination protection can be set on a stack with any status except DELETE_IN_PROGRESS or DELETE_COMPLETE
Enabling or disabling termination protection on a stack sets it for any nested stacks belonging to that stack as well. You can’t enable or disable termination protection directly on a nested stack.
If a user attempts to directly delete a nested stack belonging to a stack that has termination protection enabled, the operation fails and the nested stack remains unchanged.
If a user performs a stack update that would delete the nested stack, AWS CloudFormation deletes the nested stack accordingly.
CloudFormation Stack Policy
Stack policy can prevent stack resources from being unintentionally updated or deleted during a stack update.
By default, all update actions are allowed on all resources and anyone with stack update permissions can update all of the resources in the stack.
During an update, some resources might require an interruption or be completely replaced, resulting in new physical IDs or completely new storage and hence need to be prevented.
A stack policy is a JSON document that defines the update actions that can be performed on designated resources.
After you set a stack policy, all of the resources in the stack are protected by default.
Updates on specific resources can be added using an explicit Allow statement for those resources in the stack policy.
Only one stack policy can be defined per stack, but multiple resources can be protected within a single policy.
A stack policy applies to all CloudFormation users who attempt to update the stack. You can’t associate different stack policies with different users
A stack policy applies only during stack updates. It doesn’t provide access controls like an IAM policy.
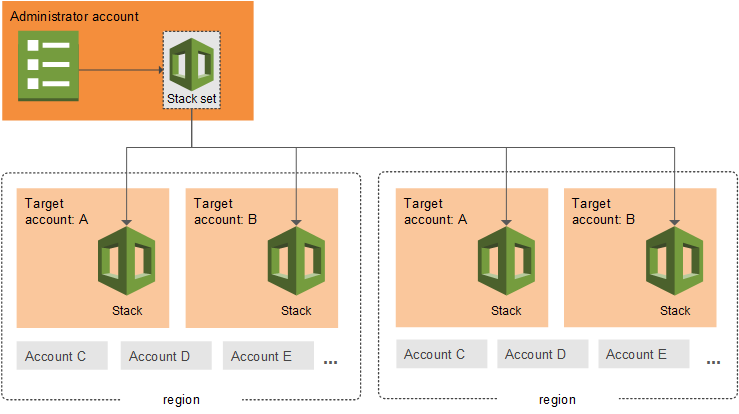
CloudFormation StackSets
CloudFormation StackSets extends the functionality of stacks by enabling you to create, update, or delete stacks across multiple accounts and Regions with a single operation.
Using an administrator account, an AWS CloudFormation template can be defined, managed, and used as the basis for provisioning stacks into selected target accounts across specified AWS Regions.
CloudFormation Registry
CloudFormation registry helps manage extensions, both public and private, such as resources, modules, and hooks that are available for use in your AWS account.
CloudFormation registry offers several advantages over custom resources
Supports the modeling, provisioning, and managing of third-party application resources
Supports the Create, Read, Update, Delete, and List (CRUDL) operations
Supports drift detection on private and third-party resource types
CloudFormation IaC Generator
IaC Generator (launched Feb 2024) helps generate CloudFormation templates for existing AWS resources that were created outside of CloudFormation.
Supports over 600 AWS resource types and provides recommendations for related resources.
Works in three steps: scan resources in your account, select resources for template generation, and generate a CloudFormation template.
Generated templates can be used to import resources into CloudFormation stacks, download for deployment, or convert to CDK apps.
Supports targeted resource scans (March 2025) to scan specific resources rather than entire accounts.
Integrates with AWS Infrastructure Composer for visual architecture review before stack creation.
CloudFormation Stack Refactoring
Stack Refactoring (Feb 2025) enables reorganization of CloudFormation resources across stacks without disrupting deployed resources.
Allows moving resources from one stack to another, splitting monolithic stacks into smaller components, and renaming logical IDs.
Maintains resource stability and operational state during reorganization.
Available via AWS CLI, Console, and CDK.
CloudFormation Drift-Aware Change Sets
Drift-Aware Change Sets (Nov 2025) provide a three-way comparison between the new template, last-deployed template, and actual infrastructure state.
Helps prevent unexpected overwrites of configuration drift made via Console, SDK, or CLI.
During execution, CloudFormation matches resource properties with template values and recreates resources deleted outside of CloudFormation.
Enables systematic drift reversion to keep infrastructure in sync with templates.
CloudFormation Hooks
CloudFormation Hooks enable proactive validation of resource configurations before provisioning.
Hooks can be authored using:
CloudFormation Guard DSL – Write rules using Guard domain-specific language stored as S3 objects
AWS Lambda functions – Implement custom validation logic in Lambda
Managed Proactive Controls – Select controls from AWS Control Tower Controls Catalog
Support stack and change set target invocation points for validating entire templates and resource relationships.
Extended to support AWS Cloud Control API (CCAPI) resource configurations for tool-agnostic control evaluation.
Can run in warn mode to test controls without blocking deployments.
CloudFormation Git Sync
Git Sync enables automatic stack deployments triggered by changes to templates in a Git repository.
Supports pull request workflows (Sept 2024) – CloudFormation posts change set information as PR comments for review.
Publishes sync status changes as events to Amazon EventBridge for event-driven automation.
Uses AWS CodeConnections to connect Git providers to CloudFormation.
AWS Infrastructure Composer
AWS Infrastructure Composer (previously known as AWS Application Composer, renamed Oct 2024) helps visually compose and configure applications backed by IaC.
Integrated into the CloudFormation console for visual stack architecture review.
Allows drag-and-drop resource composition with automatic IaC template generation.
CloudFormation Language Extensions
The AWS::LanguageExtensions transform enhances the core CloudFormation language with additional intrinsic functions:
Fn::ForEach – Loop over collections to create multiple resources or outputs from a single definition
Fn::ToJsonString – Convert an object or array to its corresponding JSON string
Fn::Length – Return the number of elements in an array
Must include AWS::LanguageExtensions in the Transform section to use these functions.
Questions are collected from Internet and the answers are marked as per my knowledge and understanding (which might differ with yours).
AWS services are updated everyday and both the answers and questions might be outdated soon, so research accordingly.
AWS exam questions are not updated to keep up the pace with AWS updates, so even if the underlying feature has changed the question might not be updated
Open to further feedback, discussion and correction.
What does Amazon CloudFormation provide?
The ability to setup Autoscaling for Amazon EC2 instances.
A templated resource creation for Amazon Web Services.
A template to map network resources for Amazon Web Services
None of these
A user is planning to use AWS CloudFormation for his automatic deployment requirements. Which of the below mentioned components are required as a part of the template?
Parameters
Outputs
Template version
Resources
In regard to AWS CloudFormation, what is a stack?
Set of AWS templates that are created and managed as a template
Set of AWS resources that are created and managed as a template
Set of AWS resources that are created and managed as a single unit
Set of AWS templates that are created and managed as a single unit
A large enterprise wants to adopt CloudFormation to automate administrative tasks and implement the security principles of least privilege and separation of duties. They have identified the following roles with the corresponding tasks in the company: (i) network administrators: create, modify and delete VPCs, subnets, NACLs, routing tables, and security groups (ii) application operators: deploy complete application stacks (ELB, Auto -Scaling groups, RDS) whereas all resources must be deployed in the VPCs managed by the network administrators (iii) Both groups must maintain their own CloudFormation templates and should be able to create, update and delete only their own CloudFormation stacks. The company has followed your advice to create two IAM groups, one for applications and one for networks. Both IAM groups are attached to IAM policies that grant rights to perform the necessary task of each group as well as the creation, update and deletion of CloudFormation stacks. Given setup and requirements, which statements represent valid design considerations? Choose 2 answers [PROFESSIONAL]
Network stack updates will fail upon attempts to delete a subnet with EC2 instances (Subnets cannot be deleted with instances in them)
Unless resource level permissions are used on the CloudFormation: DeleteStack action, network administrators could tear down application stacks (Network administrators themselves need permission to delete resources within the application stack & CloudFormation makes calls to create, modify, and delete those resources on their behalf)
The application stack cannot be deleted before all network stacks are deleted (Application stack can be deleted before network stack)
Restricting the launch of EC2 instances into VPCs requires resource level permissions in the IAM policy of the application group (IAM permissions need to be given explicitly to launch instances )
Nesting network stacks within application stacks simplifies management and debugging, but requires resource level permissions in the IAM policy of the network group (Although stacks can be nested, Network group will need to have all the application group permissions)
Your team is excited about the use of AWS because now they have access to programmable infrastructure. You have been asked to manage your AWS infrastructure in a manner similar to the way you might manage application code. You want to be able to deploy exact copies of different versions of your infrastructure, stage changes into different environments, revert back to previous versions, and identify what versions are running at any particular time (development, test, QA, production). Which approach addresses this requirement?
Use cost allocation reports and AWS Opsworks to deploy and manage your infrastructure.
Use AWS CloudWatch metrics and alerts along with resource tagging to deploy and manage your infrastructure.
Use AWS Beanstalk and a version control system like GIT to deploy and manage your infrastructure.
Use AWS CloudFormation and a version control system like GIT to deploy and manage your infrastructure.
A user is usingCloudFormation to launch an EC2 instance and then configure an application after the instance is launched. The user wants the stack creation of ELB and AutoScaling to wait until the EC2 instance is launched and configured properly. How can the user configure this?
It is not possible that the stack creation will wait until one service is created and launched
The user can use the HoldCondition resource to wait for the creation of the other dependent resources
The user can use the DependentCondition resource to hold the creation of the other dependent resources
The user can use the WaitCondition resource to hold the creation of the other dependent resources
A user has created a CloudFormation stack. The stack creates AWS services, such as EC2 instances, ELB, AutoScaling, and RDS. While creating the stack it created EC2, ELB and AutoScaling but failed to create RDS. What will CloudFormation do in this scenario?
CloudFormation can never throw an error after launching a few services since it verifies all the steps before launching
It will warn the user about the error and ask the user to manually create RDS
Rollback all the changes and terminate all the created services
It will wait for the user’s input about the error and correct the mistake after the input
A user is planning to use AWS CloudFormation. Which of the below mentioned functionalities does not help him to correctly understand CloudFormation?
CloudFormation follows the DevOps model for the creation of Dev & Test
AWS CloudFormation does not charge the user for its service but only charges for the AWS resources created with it
CloudFormation works with a wide variety of AWS services, such as EC2, EBS, VPC, IAM, S3, RDS, ELB, etc
CloudFormation provides a set of application bootstrapping scripts which enables the user to install Software
A customer is using AWS for Dev and Test. The customer wants to setup the Dev environment with CloudFormation. Which of the below mentioned steps are not required while using CloudFormation?
Create a stack
Configure a service
Create and upload the template
Provide the parameters configured as part of the template
A marketing research company has developed a tracking system that collects user behavior during web marketing campaigns on behalf of their customers all over the world. The tracking system consists of an auto-scaled group of Amazon Elastic Compute Cloud (EC2) instances behind an elastic load balancer (ELB), and the collected data is stored in Amazon DynamoDB. After the campaign is terminated, the tracking system is torn down and the data is moved to Amazon Redshift, where it is aggregated, analyzed and used to generate detailed reports. The company wants to be able to instantiate new tracking systems in any region without any manual intervention and therefore adopted AWS CloudFormation. What needs to be done to make sure that the AWS CloudFormation template works in every AWS region? Choose 2 answers [PROFESSIONAL]
IAM users with the right to start AWS CloudFormation stacks must be defined for every target region. (IAM users are global)
The names of the Amazon DynamoDB tables must be different in every target region. (DynamoDB names should be unique only within a region)
Use the built-in function of AWS CloudFormation to set the AvailabilityZone attribute of the ELB resource.
Avoid using DeletionPolicies for EBS snapshots. (Don’t want the data to be retained)
Use the built-in Mappings and FindInMap functions of AWS CloudFormation to refer to the AMI ID set in the ImageId attribute of the Auto Scaling::LaunchConfiguration resource.
A gaming company adopted AWS CloudFormation to automate load -testing of their games. They have created an AWS CloudFormation template for each gaming environment and one for the load -testing stack. The load – testing stack creates an Amazon Relational Database Service (RDS) Postgres database and two web servers running on Amazon Elastic Compute Cloud (EC2) that send HTTP requests, measure response times, and write the results into the database. A test run usually takes between 15 and 30 minutes. Once the tests are done, the AWS CloudFormation stacks are torn down immediately. The test results written to the Amazon RDS database must remain accessible for visualization and analysis. Select possible solutions that allow access to the test results after the AWS CloudFormation load -testing stack is deleted. Choose 2 answers. [PROFESSIONAL]
Define a deletion policy of type Retain for the Amazon QDS resource to assure that the RDS database is not deleted with the AWS CloudFormation stack.
Define a deletion policy of type Snapshot for the Amazon RDS resource to assure that the RDS database can be restored after the AWS CloudFormation stack is deleted.
Define automated backups with a backup retention period of 30 days for the Amazon RDS database and perform point -in -time recovery of the database after the AWS CloudFormation stack is deleted. (as the environment is required for limited time the automated backup will not serve the purpose)
Define an Amazon RDS Read-Replica in the load-testing AWS CloudFormation stack and define a dependency relation between master and replica via the DependsOn attribute. (read replica not needed and will be deleted when the stack is deleted)
Define an update policy to prevent deletion of the Amazon RDS database after the AWS CloudFormation stack is deleted. (UpdatePolicy does not apply to RDS)
When working with AWS CloudFormation Templates what is the maximum number of stacks that you can create?
5000
500
2000 (Refer link – The limit keeps on changing to check for the latest)
100
What happens, by default, when one of the resources in a CloudFormation stack cannot be created?
Previously created resources are kept but the stack creation terminates
Previously created resources are deleted and the stack creation terminates
Stack creation continues, and the final results indicate which steps failed
CloudFormation templates are parsed in advance so stack creation is guaranteed to succeed.
You need to deploy an AWS stack in a repeatable manner across multiple environments. You have selected CloudFormation as the right tool to accomplish this, but have found that there is a resource type you need to create and model, but is unsupported by CloudFormation. How should you overcome this challenge? [PROFESSIONAL]
Use a CloudFormation Custom Resource Template by selecting an API call to proxy for create, update, and delete actions. CloudFormation will use the AWS SDK, CLI, or API method of your choosing as the state transition function for the resource type you are modeling.
Submit a ticket to the AWS Forums. AWS extends CloudFormation Resource Types by releasing tooling to the AWS Labs organization on GitHub. Their response time is usually 1 day, and they complete requests within a week or two.
Instead of depending on CloudFormation, use Chef, Puppet, or Ansible to author Heat templates, which are declarative stack resource definitions that operate over the OpenStack hypervisor and cloud environment.
Create a CloudFormation Custom Resource Type by implementing create, update, and delete functionality, either by subscribing a Custom Resource Provider to an SNS topic, or by implementing the logic in AWS Lambda. (Refer link)
What is a circular dependency in AWS CloudFormation?
When a Template references an earlier version of itself.
When Nested Stacks depend on each other.
When Resources form a DependOn loop. (Refer link, to resolve a dependency error, add a DependsOn attribute to resources that depend on other resources in the template. Some cases for e.g. EIP and VPC with IGW where EIP depends on IGW need explicitly declaration for the resources to be created in correct order)
When a Template references a region, which references the original Template.
You need to run a very large batch data processing job one time per day. The source data exists entirely in S3, and the output of the processing job should also be written to S3 when finished. If you need to version control this processing job and all setup and teardown logic for the system, what approach should you use?
Model an AWS EMR job in AWS Elastic Beanstalk. (cannot directly model EMR Clusters)
Model an AWS EMR job in AWS CloudFormation. (EMR cluster can be modeled using CloudFormation. Refer link)
Model an AWS EMR job in AWS OpsWorks. (cannot directly model EMR Clusters)
Model an AWS EMR job in AWS CLI Composer. (does not exist)
Your company needs to automate 3 layers of a large cloud deployment. You want to be able to track this deployment’s evolution as it changes over time, and carefully control any alterations. What is a good way to automate a stack to meet these requirements? [PROFESSIONAL]
Use OpsWorks Stacks with three layers to model the layering in your stack.
Use CloudFormation Nested Stack Templates, with three child stacks to represent the three logical layers of your cloud. (CloudFormation allows source controlled, declarative templates as the basis for stack automation and Nested Stacks help achieve clean separation of layers while simultaneously providing a method to control all layers at once when needed)
Use AWS Config to declare a configuration set that AWS should roll out to your cloud.
Use Elastic Beanstalk Linked Applications, passing the important DNS entries between layers using the metadata interface.
You have been asked to de-risk deployments at your company. Specifically, the CEO is concerned about outages that occur because of accidental inconsistencies between Staging and Production, which sometimes cause unexpected behaviors in Production even when Staging tests pass. You already use Docker to get high consistency between Staging and Production for the application environment on your EC2 instances. How do you further de-risk the rest of the execution environment, since in AWS, there are many service components you may use beyond EC2 virtual machines? [PROFESSIONAL]
Develop models of your entire cloud system in CloudFormation. Use this model in Staging and Production to achieve greater parity. (Only CloudFormation’s JSON Templates allow declarative version control of repeatedly deployable models of entire AWS clouds. Refer link)
Use AWS Config to force the Staging and Production stacks to have configuration parity. Any differences will be detected for you so you are aware of risks.
Use AMIs to ensure the whole machine, including the kernel of the virual machines, is consistent, since Docker uses Linux Container (LXC) technology, and we need to make sure the container environment is consistent.
Use AWS ECS and Docker clustering. This will make sure that the AMIs and machine sizes are the same across both environments.
Which code snippet below returns the URL of a load balanced web site created in CloudFormation with an AWS::ElasticLoadBalancing::LoadBalancer resource name “ElasticLoad Balancer”? [Developer]
What method should I use to author automation if I want to wait for a CloudFormation stack to finish completing in a script? [Developer]
Event subscription using SQS.
Event subscription using SNS.
Poll using <code>ListStacks</code> / <code>list-stacks</code>. (Only polling will make a script wait to complete. ListStacks / list-stacks is a real method. Referlink)
Poll using <code>GetStackStatus</code> / <code>get-stack-status</code>. (GetStackStatus / get-stack-status does not exist)
Which status represents a failure state in AWS CloudFormation? [Developer]
<code>UPDATE_COMPLETE_CLEANUP_IN_PROGRESS</code> (UPDATE_COMPLETE_CLEANUP_IN_PROGRESS means an update was successful, and CloudFormation is deleting any replaced, no longer used resources)
<code>DELETE_COMPLETE_WITH_ARTIFACTS</code> (DELETE_COMPLETE_WITH_ARTIFACTS does not exist)
<code>ROLLBACK_IN_PROGRESS</code> (ROLLBACK_IN_PROGRESS means an UpdateStack operation failed and the stack is in the process of trying to return to the valid, pre-update state Referlink)
<code>ROLLBACK_FAILED</code> (ROLLBACK_FAILED is not a CloudFormation state but UPDATE_ROLLBACK_FAILED is)
Which of these is not an intrinsic function in AWS CloudFormation? [Developer]
Fn::Equals
Fn::If
Fn::Not
Fn::Parse (Complete list of Intrinsic Functions: Fn::Base64, Fn::And, Fn::Equals, Fn::If, Fn::Not, Fn::Or, Fn::FindInMap, Fn::GetAtt, Fn::GetAZs, Fn::Join, Fn::Select, Referlink)
You need to create a Route53 record automatically in CloudFormation when not running in production during all launches of a Template. How should you implement this? [Developer]
Use a <code>Parameter</code> for <code>environment</code>, and add a <code>Condition</code> on the Route53 <code>Resource</code> in the template to create the record only when <code>environment</code> is not <code>production</code>. (Best way to do this is with one template, and a Condition on the resource. Route53 does not allow null strings for Referlink)
Create two templates, one with the Route53 record value and one with a null value for the record. Use the one without it when deploying to production.
Use a <code>Parameter</code> for <code>environment</code>, and add a <code>Condition</code> on the Route53 <code>Resource</code> in the template to create the record with a null string when <code>environment</code> is <code>production</code>.
Create two templates, one with the Route53 record and one without it. Use the one without it when deploying to production.
A company has hundreds of existing AWS resources created manually via the console. They want to bring these under CloudFormation management without recreating them. What is the most efficient approach?
Manually write CloudFormation templates for each resource and use resource import
Use CloudFormation IaC Generator to scan the account, select resources, and generate templates for import into stacks
Use AWS Config to export resource configurations as CloudFormation templates
Recreate all resources using CloudFormation and delete the originals
A team needs to reorganize their monolithic CloudFormation stack into multiple smaller stacks without downtime or resource recreation. Which feature should they use?
Delete the stack with Retain deletion policy and create new stacks with resource import
Use nested stacks to logically separate resources
Use CloudFormation Stack Refactoring to move resources between stacks
Export stack outputs and create new stacks referencing them
An organization wants to enforce that all S3 buckets created via CloudFormation have encryption enabled, without relying on post-deployment checks. What should they use?
AWS Config rules to detect non-compliant resources
CloudFormation stack policies to prevent unencrypted buckets
CloudFormation Hooks with Guard rules to validate resource properties before provisioning
IAM policies to deny CreateBucket without encryption parameters
A developer notices that an EC2 instance managed by CloudFormation had its security group changed via the console. They want to detect and restore the template-defined configuration in the next deployment. Which feature addresses this?
Standard Change Sets
Drift-Aware Change Sets
Stack Policies
CloudFormation Guard
A team wants to automatically deploy CloudFormation stack updates when they push template changes to GitHub, with pull request review. Which feature should they use?
AWS CodePipeline with a CloudFormation deploy action
GitHub Actions with AWS CLI commands
CloudFormation Git Sync with pull request workflow support
AWS CodeDeploy with CloudFormation hooks
Which intrinsic function requires the AWS::LanguageExtensions transform in the template?
Fn::Select
Fn::Sub
Fn::ForEach
Fn::GetAZs
A DevOps engineer wants to deploy a networking stack before an application stack across 50 accounts using StackSets with auto-deployment. Which feature enables this ordering?
Use nested stacks with DependsOn attributes
Use StackSets deployment ordering with the DependsOn parameter in AutoDeployment configuration
Create separate StackSets and deploy them sequentially via a script
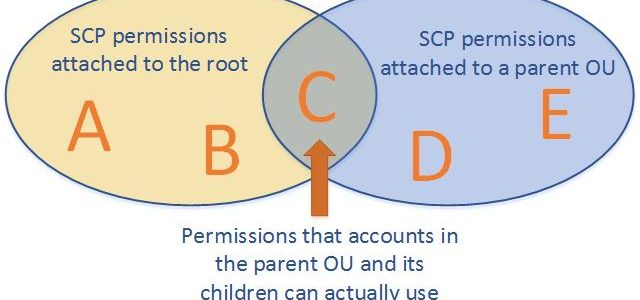
AWS Organizations Service control policies – SCPs offer central control over the maximum available permissions for all of the accounts in the organization, ensuring member accounts stay within the organization’s access control guidelines.
are one type of policy that help manage the organization.
are available only in an organization that has all features enabled, and aren’t available if the organization has enabled only the consolidated billing features.
are NOT sufficient for granting access to the accounts in the organization.
defines a guardrail for what actions accounts within the organization root or OU can do, but IAM policies need to be attached to the users and roles in the organization’s accounts to grant permissions to them.
Effective permissions are the logical intersection between what is allowed by the SCP and what is allowed by the IAM and resource-based policies.
with an SCP attached to member accounts, identity-based and resource-based policies grant permissions to entities only if those policies and the SCP allow the action.
don’t affect users or roles in the management account. They affect only the member accounts in your organization.
SCPs also apply to member accounts that are designated as delegated administrators.
work alongside Resource Control Policies (RCPs) and Declarative Policies to provide comprehensive preventive controls across an organization.
SCPs Effects on Permissions
never grant permissions but define the maximum permissions for the affected accounts.
Users and roles must still be granted permissions with appropriate IAM permission policies. A user without any IAM permission policies has no access at all, even if the applicable SCPs allow all services and all actions.
limits permissions for entities in member accounts, including each AWS account root user.
does not limit actions performed by the management account.
does not affect any service-linked role. Service-linked roles enable other AWS services to integrate with AWS Organizations and can’t be restricted by SCPs.
affect only IAM users or roles that are managed by accounts that are part of the organization. They don’t affect users or roles from accounts outside the organization.
don’t affect resource-based policies directly.
SCPs focus on identity-based (principal) permissions, while RCPs focus on resource-based permissions. Together they establish a comprehensive data perimeter.
SCPs Strategies
By default, an SCP named FullAWSAccess is attached to every root, OU, and account, which allows all actions and all services.
Blacklist or Deny Strategy
actions are allowed by default and services and actions to be prohibited need to be specified.
blacklist permissions using deny statements can be assigned in combination with the default FullAWSAccess SCP.
using deny statements in SCPs require less maintenance because they don’t need to be updated when AWS adds new services.
deny statements usually use less space, thus making it easier to stay within SCP size limits.
Whitelist or Allow Strategy
actions are prohibited by default, and you specify what services and actions are allowed.
whitelist permissions can be assigned, by removing the default FullAWSAccess SCP.
allows SCP that explicitly permits only those allowed services and actions
SCP Full IAM Policy Language Support
As of September 2025, SCPs now support the full IAM policy language, removing previous limitations.
Newly supported capabilities include:
Condition element in Allow statements – enables contextual boundaries like restricting by Region or account.
NotAction in Allow statements – allows specifying exempt actions.
Resource with specific ARNs in Allow statements – enables scoped resource access.
NotResource in both Allow and Deny statements – simplifies exceptions for service-owned resources.
Wildcards (*, ?) anywhere in Action/NotAction elements (e.g., "servicename:*action", "servicename:some*action").
These enhancements enable more precise, concise, and scalable policies without complex workarounds.
AWS recommends using explicit Deny statements as best practice and avoiding overlapping Allow statements.
Use IAM Access Analyzer to validate SCPs before applying them.
SCP Quotas (Updated May 2026)
Maximum SCP size: 10,240 characters (doubled from previous 5,120 limit in May 2026).
Maximum SCPs per node (root, OU, or account): 10 (increased from previous limit of 5).
Maximum SCPs in an organization: 2,000.
Maximum nesting depth of OUs: 5 levels.
These increased quotas are automatically available across all commercial, GovCloud, and China Regions with no request needed.
SCPs Testing Effects
don’t attach SCPs to the root of the organization without thoroughly testing the impact that the policy has on accounts.
Create an OU that the accounts can be moved into one at a time, or at least in small numbers, to ensure that users are not inadvertently locked out of key services.
Use IAM Access Analyzer policy validation and custom policy checks to verify SCP correctness before deployment.
Resource Control Policies (RCPs)
Resource Control Policies (RCPs), launched in November 2024, are a new authorization policy type in AWS Organizations.
RCPs set the maximum available permissions on resources within your organization, complementing SCPs which set maximum permissions on principals.
Help centrally establish a data perimeter by restricting external access to resources at scale.
RCPs are evaluated when resources are accessed, irrespective of who is making the API request.
Use Deny statements to restrict access (similar to SCPs).
A default RCPFullAWSAccess policy is automatically attached to every entity when RCPs are enabled.
RCPs don’t affect resources in the management account.
Supported services (expanding): Amazon S3, AWS STS, AWS KMS, Amazon SQS, AWS Secrets Manager, Amazon ECR, Amazon OpenSearch Serverless, Amazon Cognito, Amazon CloudWatch Logs, and more being added.
SCPs and RCPs have independent quotas — each RCP can have up to 5,120 characters, with up to 5 RCPs per node and 1,000 RCPs per organization.
Neither SCPs nor RCPs grant permissions — they only restrict the maximum available permissions.
SCP vs RCP Comparison
Feature
SCP (Service Control Policy)
RCP (Resource Control Policy)
Controls
Maximum permissions for principals (IAM users/roles)
Maximum permissions on resources
Scope
What principals can do
Who can access resources
Evaluation
Evaluated based on who is making the request
Evaluated when resources are accessed, regardless of requester
Management account
Not affected
Not affected
Default policy
FullAWSAccess
RCPFullAWSAccess
Max size
10,240 characters
5,120 characters
Max per node
10
5
Declarative Policies
Declarative Policies, launched in December 2024, are a new management policy type in AWS Organizations.
Allow you to declare and enforce desired configuration for AWS services at scale across the organization.
Unlike SCPs/RCPs (which restrict API actions), declarative policies enforce the desired state of service attributes.
Once set, the configuration is maintained even as new features or APIs are added — no policy maintenance overhead.
Enforcement applies regardless of whether the action was invoked by an IAM role or a service-linked role.
Support custom error messages so end users see actionable guidance when actions are restricted.
Provide an account status report to assess current state before applying policies.
Supported service attributes (at launch — EC2, VPC, EBS):
Enforce IMDSv2 for EC2 instances
Block public access for Amazon EBS snapshots
Block public access for Amazon EC2 AMIs
Block public access for Amazon VPC (internet gateway control)
Allowed AMI image settings (restrict to trusted providers)
Serial console access control
Can be applied at organization, OU, or account level.
Manageable via AWS Organizations console, CLI, CloudFormation, or AWS Control Tower.
AWS Organizations Policy Types Summary
Policy Type
Purpose
Mechanism
SCPs
Restrict maximum permissions for principals
Allow/Deny API actions for IAM users and roles
RCPs
Restrict maximum permissions on resources
Deny external access to resources
Declarative Policies
Enforce desired service configuration
Set desired state for service attributes
AWS Certification Exam Practice Questions
Questions are collected from Internet and the answers are marked as per my knowledge and understanding (which might differ with yours).
AWS services are updated everyday and both the answers and questions might be outdated soon, so research accordingly.
AWS exam questions are not updated to keep up the pace with AWS updates, so even if the underlying feature has changed the question might not be updated
Open to further feedback, discussion and correction.
Your company is planning on setting up multiple accounts in AWS. The IT Security department has a requirement to ensure that certain services and actions are not allowed across all accounts. How would the system admin achieve this in the most EFFECTIVE way possible?
Create a common IAM policy that can be applied across all accounts
Create an IAM policy per account and apply them accordingly
Deny the services to be used across accounts by contacting AWS support
Use AWS Organizations and Service Control Policies
You are in the process of implementing AWS Organizations for your company. At your previous company, you saw an Organizations implementation go bad when an SCP (Service Control Policy) was applied at the root of the organization before being thoroughly tested. In what way can an SCP be properly tested and implemented?
Back up your entire Organization to S3 and restore rollback and restore if something goes wrong
The SCP must be verified with AWS before it is implemented to avoid any problems.
Mirror your Organizational Unit in another region. Apply the SCP and test it. Once testing is complete, attach the SCP to the root of your organization.
Create an Organizational Unit (OU). Attach the SCP to this new OU. Move your accounts in one at a time to ensure that you don’t inadvertently lock users out of key services.
A security team wants to prevent any external AWS accounts from accessing their organization’s S3 buckets, regardless of what resource-based policies individual developers might configure. Which approach should they use?
Apply an SCP to deny all S3 actions from external principals
Use AWS Config rules to detect non-compliant bucket policies
Apply a Resource Control Policy (RCP) that restricts S3 access to principals within the organization
Configure S3 Block Public Access at the account level
An organization needs to ensure that all EC2 instances launched across hundreds of accounts use IMDSv2, even if new APIs or features are added in the future. They also want end users to see a custom error message explaining why their configuration was blocked. What is the BEST solution?
Create an SCP denying ec2:RunInstances without the IMDSv2 metadata condition
Use AWS Config with auto-remediation to terminate non-compliant instances
Apply a Declarative Policy for EC2 that enforces IMDSv2 with a custom error message
Create a Lambda function triggered by CloudTrail to stop non-compliant instances
A company wants to implement a data perimeter strategy that controls both which principals can perform actions AND who can access their AWS resources. Which combination of AWS Organizations policies provides the most comprehensive data perimeter?
SCPs and AWS Config rules
SCPs and Resource Control Policies (RCPs)
SCPs and VPC endpoint policies only
IAM permission boundaries and SCPs
An administrator needs to restrict EC2 actions to only 3 specific AWS Regions for all accounts. Previously this required both an Allow and a separate Deny statement. With recent SCP enhancements, what is the simplified approach?
Use a Deny statement with StringNotEquals condition on aws:RequestedRegion
Use an Allow statement with a Condition element specifying aws:RequestedRegion
Create separate SCPs per region and attach them to respective OUs
Use declarative policies to block EC2 access outside specific regions
AWS Certified Data Analytics – Specialty (DAS-C01) was retired on April 9, 2024.
AWS retired the DAS-C01 exam along with two other specialty certifications (Database – Specialty and SAP on AWS – Specialty) in April 2024.
This content is maintained for historical reference and for learning AWS analytics services.
Replacement Certification:
AWS Certified Data Engineer – Associate (DEA-C01) – Launched March 2024, validates ability to implement data pipelines, monitor and troubleshoot issues, and optimize cost and performance. Covers data ingestion, transformation, storage, operations, security, and governance. 65 questions, 130 minutes, $150, passing score 720.
AWS Certified Data Analytics – Specialty (DAS-C01) Exam Summary
Specialty exams are tough, lengthy, and tiresome. Most of the questions and answers options have a lot of prose and a lot of reading that needs to be done, so be sure you are prepared and manage your time well.
DAS-C01 exam has 65 questions to be solved in 170 minutes which gives you roughly 2 1/2 minutes to attempt each question.
DAS-C01 exam includes two types of questions, multiple-choice and multiple-response.
DAS-C01 has a scaled score between 100 and 1,000. The scaled score needed to pass the exam is 750.
Specialty exams currently cost $ 300 + tax.
You can get an additional 30 minutes if English is your second language by requesting Exam Accommodations. It might not be needed for Associate exams but is helpful for Professional and Specialty ones.
As always, mark the questions for review and move on and come back to them after you are done with all.
As always, having a rough architecture or mental picture of the setup helps focus on the areas that you need to improve. Trust me, you will be able to eliminate 2 answers for sure and then need to focus on only the other two. Read the other 2 answers to check the difference area and that would help you reach the right answer or at least have a 50% chance of getting it right.
AWS exams can be taken either remotely or online, I prefer to take them online as it provides a lot of flexibility. Just make sure you have a proper place to take the exam with no disturbance and nothing around you.
Also, if you are taking the AWS Online exam for the first time try to join at least 30 minutes before the actual time as I have had issues with both PSI and Pearson with long wait times.
AWS Certified Data Analytics – Specialty (DAS-C01) Exam Topics
AWS Certified Data Analytics – Specialty exam, as its name suggests, covers a lot of Big Data concepts right from data collection, ingestion, transfer, storage, pre and post-processing, analytics, and visualization with the added concepts for data security at each layer.
Analytics
Make sure you know and cover all the services in-depth, as 80% of the exam is focused on topics like Glue, Kinesis, and Redshift.
AWS Glue is a fully managed, ETL service that automates the time-consuming steps of data preparation for analytics.
supports server-side encryption for data at rest and SSL for data in motion.
Glue ETL engine to Extract, Transform, and Load data that can automatically generate Scala or Python code.
Glue Data Catalog is a central repository and persistent metadata store to store structural and operational metadata for all the data assets. It works with Apache Hive as its metastore.
Glue Crawlers scan various data stores to automatically infer schemas and partition structures to populate the Data Catalog with corresponding table definitions and statistics.
Glue Job Bookmark tracks data that has already been processed during a previous run of an ETL job by persisting state information from the job run.
Glue Streaming ETL enables performing ETL operations on streaming data using continuously-running jobs.
Glue provides flexible scheduler that handles dependency resolution, job monitoring, and retries.
Glue Studio offers a graphical interface for authoring AWS Glue jobs to process data allowing you to define the flow of the data sources, transformations, and targets in the visual interface and generating Apache Spark code on your behalf.
Glue Data Quality helps reduces manual data quality efforts by automatically measuring and monitoring the quality of data in data lakes and pipelines.
Glue DataBrew helps prepare, visualize, clean, and normalize data directly from the data lake, data warehouses, and databases, including S3, Redshift, Aurora, and RDS.
Redshift Distribution Style determines how data is distributed across compute nodes and helps minimize the impact of the redistribution step by locating the data where it needs to be before the query is executed.
Redshift Enhanced VPC routing forces all COPY and UNLOAD traffic between the cluster and the data repositories through the VPC.
Workload management (WLM) enables users to flexibly manage priorities within workloads so that short, fast-running queries won’t get stuck in queues behind long-running queries.
Redshift Spectrum helps query and retrieve structured and semistructured data from files in S3 without having to load the data into Redshift tables.
Federated Query feature allows querying and analyzing data across operational databases, data warehouses, and data lakes.
Redshift Serverless is a serverless option of Redshift that makes it more efficient to run and scale analytics in seconds without the need to set up and manage data warehouse infrastructure.
Redshift Best Practices w.r.t selection of Distribution style, Sort key, importing/exporting data
COPY command which allows parallelism, and performs better than multiple COPY commands
COPY command can use manifest files to load data
COPY command handles encrypted data
Redshift Resizing cluster options (elastic resize did not support node type changes before, but does now)
Redshift supports encryption at rest and in transit
Redshift supports encrypting an unencrypted cluster using KMS. However, you can’t enable hardware security module (HSM) encryption by modifying the cluster. Instead, create a new, HSM-encrypted cluster and migrate your data to the new cluster.
supports SSE-S3, SS3-KMS, CSE-KMS, and CSE-Custom encryption for EMRFS
supports LUKS encryption for local disks
supports TLS for data in transit encryption
supports EBS encryption
Hive metastore can be externally hosted using RDS, Aurora, and AWS Glue Data Catalog
Know also different technologies
Presto is a fast SQL query engine designed for interactive analytic queries over large datasets from multiple sources
Spark is a distributed processing framework and programming model that helps do machine learning, stream processing, or graph analytics using Amazon EMR clusters
Zeppelin/Jupyter as a notebook for interactive data exploration and provides open-source web application that can be used to create and share documents that contain live code, equations, visualizations, and narrative text
Phoenix is used for OLTP and operational analytics, allowing you to use standard SQL queries and JDBC APIs to work with an Apache HBase backing store
Know Kinesis Data Streams is open-ended for both producer and consumer. It supports KCL and works with Spark.
Know Amazon Data Firehose is open-ended for producers only. Data is stored in S3, Redshift, and OpenSearch.
Data Firehose works in batches with minimum 60secs intervals and in near-real time.
Data Firehose supports out-of-the-box transformation and custom transformation using Lambda
Kinesis supports encryption at rest using server-side encryption
Kinesis Producer Library supports batching
Amazon Managed Service for Apache Flink (formerly Kinesis Data Analytics)
helps transform and analyze streaming data in real time using Apache Flink.
supports anomaly detection using Random Cut Forest ML
supports reference data stored in S3.
Note: Kinesis Data Analytics for SQL applications was discontinued effective January 27, 2026. Migrate to Amazon Managed Service for Apache Flink or Apache Flink Studio.
QuickSight provides IP addresses that need to be whitelisted for QuickSight to access the data store.
QuickSight provides direct integration with Microsoft AD
QuickSight supports Row level security using dataset rules to control access to data at row granularity based on permissions associated with the user interacting with the data.
QuickSight supports ML insights as well
QuickSight supports users defined via IAM or email signup.
is a serverless, interactive analytics service built on open-source frameworks, supporting open-table and file formats.
provides a simplified, flexible way to analyze data in an S3 data lake and 30 data sources, including on-premises data sources or other cloud systems using SQL or Python without loading the data.
integrates with QuickSight for visualizing the data or creating dashboards.
uses a managed Glue Data Catalog to store information and schemas about the databases and tables that you create for the data stored in S3
Workgroups can be used to separate users, teams, applications, or workloads, to set limits on the amount of data each query or the entire workgroup can process, and to track costs.
Athena best practices recommended partitioning the data, partition projection, and using the Columnar file format like ORC or Parquet as they support compression and are splittable.
Note: AWS Data Pipeline was closed to new customers effective July 25, 2024. The service is in maintenance mode. Consider AWS Glue, Amazon MWAA, or AWS Step Functions as alternatives.
Security, Identity & Compliance
Data security is a key concept controlled in the Data Analytics – Specialty exam
AWS Directory Services is a managed service offering, providing directories that contain information about the organization, including users, groups, computers, and other resources.
AWS Directory Services provides multiple ways including
Simple AD – a standalone directory service powered by Samba 4
AD Connector – acts as a proxy to use On-Premise Microsoft Active Directory with other AWS services.
AWS Managed Microsoft AD (Standard Edition) – fully managed Microsoft Active Directory for up to 30,000 objects
AWS Managed Microsoft AD (Enterprise Edition) – fully managed Microsoft Active Directory for up to 500,000 objects with multi-region support
AWS Managed Microsoft AD (Hybrid Edition) – extends an existing self-managed AD domain to AWS (launched August 2025)
AWS Managed Microsoft AD is powered by Windows Server 2019 and creates a highly available pair of domain controllers across different Availability Zones.
What’s New in AWS Directory Service (2024-2026)
Hybrid Edition (Aug 2025) – New edition that extends existing on-premises or multi-cloud AD domain to AWS Managed Microsoft AD, automatically handling replication and maintenance between environments.
Directory Service Data APIs (2025) – Perform CRUD operations on users and groups directly through AWS CLI, APIs, and the AWS Management Console without deploying dedicated management instances.
IPv6 Support (Oct 2025) – Dual-stack (IPv4 and IPv6) configurations for Managed Microsoft AD, AD Connector, and Simple AD. Existing IPv4-only directories can be upgraded to dual-stack.
API-Driven Edition Upgrades (Oct 2025) – Upgrade Managed Microsoft AD from Standard to Enterprise Edition programmatically via the UpdateDirectorySetup API without support tickets.
Multi-Region Replication for Opt-In Regions (Apr 2026) – Multi-region replication now supports Opt-In regions in addition to default regions.
Amazon Cloud Directory – No longer open to new customers as of November 7, 2025. Alternatives include Amazon DynamoDB and Amazon Neptune.
Simple AD
is a Microsoft Active Directory compatible directory from AWS Directory Service that is powered by Samba 4.
is the least expensive option and the best choice if there are 5,000 or fewer users & don’t need the more advanced Microsoft Active Directory features.
supports commonly used Active Directory features such as user accounts, group memberships, domain-joining EC2 instances running Linux and Windows, Kerberos-based single sign-on (SSO), and group policies.
does not support features like DNS dynamic update, schema extensions, multi-factor authentication, communication over LDAPS, PowerShell AD cmdlets, and the transfer of FSMO roles
provides daily automated snapshots to enable point-in-time recovery
Trust relationships between Simple AD and other Active Directory domains cannot be set up.
does not support MFA, RDS SQL Server, or AWS IAM Identity Center (formerly AWS SSO).
supports dual-stack (IPv4 and IPv6) network configurations (Oct 2025)
Available in two sizes:
Small – supports up to 500 users (approximately 2,000 objects)
Large – supports up to 5,000 users (approximately 20,000 objects)
AD Connector
helps connect to an existing on-premises Active Directory to AWS
is the best choice to leverage an existing on-premises directory with AWS services
is a proxy service for connecting on-premises Microsoft Active Directory to AWS without requiring complex directory synchronization technologies or the cost and complexity of hosting a federation infrastructure
forwards sign-in requests to the Active Directory domain controllers for authentication and provides the ability for applications to query the directory for data
enables consistent enforcement of existing security policies, such as password expiration, password history, and account lockouts, whether users are accessing resources on-premises or in the AWS cloud
supports AWS IAM Identity Center (formerly AWS SSO) integration for centralized access management
supports dual-stack (IPv4 and IPv6) network configurations (Oct 2025)
can be upgraded from Small to Large, but cannot be downgraded
Microsoft Active Directory (Standard & Enterprise Editions)
is a feature-rich managed Microsoft Active Directory hosted on AWS, powered by Windows Server 2019
Standard Edition – supports up to 30,000 AD objects, up to 25 account shares
Enterprise Edition – supports up to 500,000 AD objects, up to 500 account shares, and multi-region replication
supports trust relationship (forest trust) set up between an AWS-hosted directory and on-premises directories providing users and groups with access to resources in either domain, using single sign-on (SSO) without the need to synchronize or replicate the users, groups, or passwords.
requires a VPN or Direct Connect connection for trust relationships with on-premises AD.
provides much of the functionality offered by Microsoft Active Directory plus integration with AWS applications.
provides a highly available pair of domain controllers running in different AZs connected to the VPC in a Region of your choice.
supports MFA by integrating with an existing RADIUS-based MFA infrastructure to provide an additional layer of security when users access AWS applications.
automatically configures and manages host monitoring and recovery, data replication, snapshots, and software updates.
supports RDS for SQL Server, AWS Workspaces, Quicksight, WorkDocs, Amazon Connect, etc.
integrates with AWS IAM Identity Center (formerly AWS SSO) for centralized multi-account access management.
supports Multi-Region Replication (Enterprise Edition only) – automatically replicates directory data including users, groups, Group Policy Objects, and schema across multiple AWS Regions.
supports API-driven edition upgrades – upgrade from Standard to Enterprise Edition via the UpdateDirectorySetup API without support tickets (Oct 2025).
supports dual-stack (IPv4 and IPv6) network configurations (Oct 2025)
AWS Managed Microsoft AD (Hybrid Edition)
Launched in August 2025 as a new edition of AWS Managed Microsoft AD.
Extends an existing self-managed Active Directory domain to AWS, whether hosted on-premises, on AWS, or in a multi-cloud environment.
Automatically handles replication and maintenance between your existing AD environments and AWS.
Creates an integrated identity environment that spans on-premises, AWS, and multi-cloud infrastructure while maintaining a single source of identity.
Provides a simpler way to migrate AD-dependent workloads to the cloud while preserving existing AD data, identity, and access infrastructure.
Supports native Active Directory schema extensions (e.g., for deploying Microsoft Exchange Server).
Unlike trust-based approaches, Hybrid Edition provides a unified AD deployment rather than separate forests with trust relationships.
Best suited when you want to extend (not replicate) your existing domain to AWS with full schema and data preservation.
Directory Service Data (User & Group Management APIs)
AWS Directory Service Data enables CRUD (Create, Read, Update, Delete) operations on users and groups directly through AWS CLI, APIs, and the AWS Management Console.
Eliminates the need to deploy dedicated management EC2 instances to manage directory users and groups.
Supports operations including CreateUser, CreateGroup, UpdateUser, DeleteUser, ListUsers, ListGroups, and membership management.
Enables automation of identity lifecycle management and enhances security in AWS environments.
Available at no additional cost for AWS Managed Microsoft AD customers.
Write operations are limited to the organizational unit (OU) of your AWS Managed Microsoft AD.
AWS Directory Services Comparison
Feature
Simple AD
AD Connector
Managed Microsoft AD (Standard/Enterprise)
Managed Microsoft AD (Hybrid)
Type
Standalone (Samba 4)
Proxy to on-premises AD
Fully managed AD in AWS
Extends existing AD to AWS
Trust Relationships
Not supported
N/A (proxy)
Supported (forest trust)
Not needed (same domain)
MFA
Not supported
Supported (RADIUS)
Supported (RADIUS)
Supported (RADIUS)
IAM Identity Center
Not supported
Supported
Supported
Supported
Multi-Region Replication
Not supported
Not supported
Enterprise Edition only
Not supported
IPv6 (Dual-stack)
Supported
Supported
Supported
Supported
Schema Extensions
Not supported
N/A (proxy)
Supported
Supported (native)
VPN/DX Required
No
Yes
Yes (for trust to on-premises)
Yes
Best For
Small orgs, ≤5,000 users, basic AD
Leveraging existing on-premises AD
Full AD features in AWS, >5,000 users
Extending existing AD domain to AWS
Microsoft AD Connectivity Options
If the VGW is used to connect to the On-Premise AD is not stable or has connectivity issues, the following options can be explored
Simple AD
lower cost, low scale, basic AD compatible, or LDAP compatibility
provides a standalone instance for the Microsoft AD in AWS
No single point of Authentication or Authorization, as a separate copy is maintained
trust relationships cannot be set up between Simple AD and other Active Directory domains
AWS Managed Microsoft AD (Hybrid Edition) (New – 2025)
extends existing on-premises AD domain directly to AWS
automatically handles replication between environments
maintains a single source of identity across on-premises and AWS
requires VPN or Direct Connect for connectivity to on-premises
Read-only Domain Controllers (RODCs)
works out as a Read-only Active Directory
holds a copy of the Active Directory Domain Service (AD DS) database and responds to authentication requests.
are typically deployed in locations where physical security cannot be guaranteed.
they cannot be written to by applications or other servers.
helps maintain a single point to authentication & authorization controls, however, needs to be synced.
Writable Domain Controllers
are expensive to setup
operate in a multi-master model; changes can be made on any writable server in the forest, and those changes are replicated to servers throughout the entire forest
AWS Certification Exam Practice Questions
Questions are collected from Internet and the answers are marked as per my knowledge and understanding (which might differ with yours).
AWS services are updated everyday and both the answers and questions might be outdated soon, so research accordingly.
AWS exam questions are not updated to keep up the pace with AWS updates, so even if the underlying feature has changed the question might not be updated
Open to further feedback, discussion and correction.
The majority of your Infrastructure is on-premises and you have a small footprint on AWS. Your company has decided to roll out a new application that is heavily dependent on low latency connectivity to LDAP for authentication. Your security policy requires minimal changes to the company’s existing application user management processes. What option would you implement to successfully launch this application?
Create a second, independent LDAP server in AWS for your application to use for authentication (independent would not work for authentication as its a separate copy)
Establish a VPN connection so your applications can authenticate against your existing on-premises LDAP servers (not a low latency solution)
Establish a VPN connection between your data center and AWS create an LDAP replica on AWS and configure your application to use the LDAP replica for authentication (RODCslow latency and minimal setup)
Create a second LDAP domain on AWS establish a VPN connection to establish a trust relationship between your new and existing domains and use the new domain for authentication (Not minimal effort)
A company is preparing to give AWS Management Console access to developers Company policy mandates identity federation and role-based access control. Roles are currently assigned using groups in the corporate Active Directory. What combination of the following will give developers access to the AWS console? (Select 2) Choose 2 answers
AWS Directory Service AD Connector (for Corporate Active directory)
AWS Directory Service Simple AD
AWS Identity and Access Management groups
AWS Identity and Access Management roles
AWS Identity and Access Management users
An Enterprise customer is starting their migration to the cloud, their main reason for migrating is agility, and they want to make their internal Microsoft Active Directory available to any applications running on AWS; this is so internal users only have to remember one set of credentials and as a central point of user control for leavers and joiners. How could they make their Active Directory secure, and highly available, with minimal on-premises infrastructure changes, in the most cost and time-efficient way? Choose the most appropriate
Using Amazon Elastic Compute Cloud (EC2), they would create a DMZ using a security group; within the security group they could provision two smaller Amazon EC2 instances that are running Openswan for resilient IPSEC tunnels, and two larger instances that are domain controllers; they would use multiple Availability Zones (Whats Openswan? Refer Implementation)
Using VPC, they could create an extension to their data center and make use of resilient hardware IPSEC tunnels; they could then have two domain controller instances that are joined to their existing domain and reside within different subnets, in different Availability Zones (highly available with 2 AZ’s, secure with VPN connection and minimal changes)
Within the customer’s existing infrastructure, they could provision new hardware to run Active Directory Federation Services; this would present Active Directory as a SAML2 endpoint on the internet; any new application on AWS could be written to authenticate using SAML2 (not minimal on-premises hardware changes)
The customer could create a stand-alone VPC with its own Active Directory Domain Controllers; two domain controller instances could be configured, one in each Availability Zone; new applications would authenticate with those domain controllers (not a central location, but a copy)
A company needs to deploy virtual desktops to its customers in a virtual private cloud, leveraging existing security controls. Which set of AWS services and features will meet the company’s requirements?
Virtual Private Network connection. AWS Directory Services, and ClassicLink (ClassicLink allows you to link an EC2-Classic instance to a VPC in your account, within the same region)
Virtual Private Network connection. AWS Directory Services, and Amazon Workspaces (WorkSpaces for Virtual desktops, and AWS Directory Services to authenticate to an existing on-premises AD through VPN)
AWS Directory Service, Amazon Workspaces, and AWS Identity and Access Management (AD service needs a VPN connection to interact with an On-premise AD directory)
Amazon Elastic Compute Cloud, and AWS Identity and Access Management (Need WorkSpaces for virtual desktops)
An Enterprise customer is starting their migration to the cloud, their main reason for migrating is agility and they want to make their internal Microsoft active directory available to any applications running on AWS, this is so internal users only have to remember one set of credentials and as a central point of user control for leavers and joiners. How could they make their active directory secure and highly available with minimal on-premises infrastructure changes in the most cost and time-efficient way? Choose the most appropriate:
Using Amazon EC2, they could create a DMZ using a security group, within the security group they could provision two smaller Amazon EC2 instances that are running Openswan for resilient IPSEC tunnels and two larger instances that are domain controllers, they would use multiple availability zones.
Using VPC, they could create an extension to their data center and make use of resilient hardware IPSEC tunnels, they could then have two domain controller instances that are joined to their existing domain and reside within different subnets in different availability zones.
Within the customer’s existing infrastructure, they could provision new hardware to run active directory federation services, this would present active directory as a SAML2 endpoint on the internet and any new application on AWS could be written to authenticate using SAML2 (not a minimal change to the existing infrastructure)
The customer could create a stand alone VPC with its own active directory domain controllers, two domain controller instances could be configured, one in each availability zone, new applications would authenticate with those domain controllers. (Standalone cannot use the same security)
You run a 2000-engineer organization. You are about to begin using AWS at a large scale for the first time. You want to integrate with your existing identity management system running on Microsoft Active Directory because your organization is a power-user of Active Directory. How should you manage your AWS identities in the simplest manner?
Use a large AWS Directory Service Simple AD.
Use a large AWS Directory Service AD Connector. (AD Connector can be used as power-user of Microsoft Active Directory. Simple AD only works with a subset of AD functionality)
Use a Sync Domain running on AWS Directory Service.
Use an AWS Directory Sync Domain running on AWS Lambda.
A company wants to extend its on-premises Active Directory to AWS with minimal changes to its existing identity infrastructure while maintaining a unified directory across both environments. They need full schema support and automatic replication. Which solution best meets these requirements?
Set up AWS Managed Microsoft AD with a forest trust to the on-premises AD (Trust creates separate forests, not a unified directory)
Use AD Connector to proxy authentication to on-premises AD (Proxy only, no directory extension or replication)
Use AWS Managed Microsoft AD (Hybrid Edition) to extend the existing domain to AWS (Hybrid Edition extends the existing domain with automatic replication and full schema support)
Deploy self-managed domain controllers on EC2 instances (Not a managed solution, requires manual maintenance)
A company uses AWS Managed Microsoft AD and wants to automate user provisioning and deprovisioning without deploying management EC2 instances. Which approach should they use?
Use PowerShell AD cmdlets on a Windows bastion host
Configure LDAP tools on an EC2 instance connected to the directory
Use AWS Directory Service Data APIs to perform CRUD operations on users and groups (Directory Service Data APIs enable user/group management via CLI, APIs, and Console without additional infrastructure)
Use AWS Lambda with custom LDAP libraries to manage users
An organization needs a managed Active Directory in AWS that supports multi-region replication for global workloads. Which configuration meets this requirement?
AWS Managed Microsoft AD Standard Edition with multi-region enabled
AWS Managed Microsoft AD Enterprise Edition with multi-region replication (Multi-region replication is only supported in Enterprise Edition)
Simple AD deployed in multiple regions with cross-region VPC peering
AD Connector in each region pointing to the same on-premises AD
AWS Security Hub has been significantly reimagined. The original Security Hub is now called AWS Security Hub CSPM (Cloud Security Posture Management), while the new AWS Security Hub is a unified cloud security operations solution that correlates findings across multiple AWS security services. Both services complement each other and are recommended to be used together.
AWS Security Hub is a unified cloud security operations solution that prioritizes critical security issues and helps respond at scale by correlating and enriching signals across multiple AWS security services.
provides near real-time risk analytics, trends, unified enablement, streamlined pricing, and automated correlation that transforms security signals into actionable insights.
automatically aggregates and correlates signals from Amazon GuardDuty, Amazon Inspector, AWS Security Hub CSPM, and Amazon Macie, organizing them by threats, exposures, resources, and security coverage.
AWS Security Hub CSPM (previously known as Security Hub) performs security best practice checks, aggregates alerts, and enables automated remediation.
collects security data from across AWS accounts, services, and supported third-party partner products and helps analyze the security trends and identify the highest priority security issues.
is Regional and only receives and processes findings from the Region where it is enabled. However, it supports cross-Region aggregation of findings, resources, and trends from multiple AWS Regions into a single home Region.
must be enabled in each region to view findings in that region.
Security Hub CSPM automatically runs continuous, account-level configuration and security checks based on AWS best practices and industry standards which include
consolidates the security findings across accounts and provider products and displays results on the Security Hub console.
supports integration with Amazon EventBridge. Custom actions can be defined when a finding is received.
supports integration with Jira and ServiceNow for incident management workflows, including automated ticket creation based on finding criteria.
only detects and consolidates findings that are generated after the Security Hub is enabled.
has multi-account management through AWS Organizations integration, which allows delegating an administrator account for the organization.
uses service-linked AWS Config rules to perform most of its security checks for controls. AWS Config must be enabled on all accounts – both the administrator account and member accounts – in each Region where Security Hub is enabled.
works with a service-linked role named AWSServiceRoleForSecurityHub which includes the permissions and trust policy to do the following:
Detect and aggregate findings from Amazon GuardDuty, Amazon Inspector, and Amazon Macie
Configure the requisite AWS Config infrastructure to run security checks for the supported standards
findings use the Open Cybersecurity Schema Framework (OCSF) format for partner integrations, enabling seamless data sharing across security tools. Security Hub CSPM uses the AWS Security Finding Format (ASFF) for control findings.
Security Hub Plans
Security Hub uses a streamlined, resource-based pricing model with the following plans:
Essentials Plan (Default)
The Essentials plan is the default level of coverage included with Security Hub.
Consolidates Security Hub, Amazon Inspector, and Security Hub CSPM into a single per-resource price with unlimited scans.
EC2 vulnerability scanning (agent-based and agentless)
ECR container image vulnerability scanning
Lambda function vulnerability scanning
EC2 CIS Benchmark assessments
Posture management (CSPM)
Resource unit ratios: 1 EC2 = 1 unit | 12 Lambda = 1 unit | 18 ECR images = 1 unit | 125 IAM users/roles = 1 unit
Includes a 30-day free trial for all customers.
Threat Analytics (Add-on)
Adds automated threat detection powered by Amazon GuardDuty across CloudTrail, VPC, DNS, S3, EKS, and Lambda.
Usage-based pricing on events and log volume.
Requires the Essentials plan.
Includes EC2/EBS malware protection at no additional charge.
Extended Plan (Add-on)
Adds curated enterprise partner solutions across 9 security categories: endpoint, identity, email, network, data, browser, cloud, AI, and security operations.
Pay-as-you-go pricing with no upfront commitment.
Includes 21 curated partner solutions from providers such as CrowdStrike, SentinelOne, Okta, CyberArk, Proofpoint, Splunk, Zscaler, Varonis, and others.
Simplifies procurement with consolidated billing through AWS.
Extends protection beyond AWS to multicloud and on-premises environments.
Eligible for Enterprise Discount Program (EDP) credits.
Security Hub Key Features
Near Real-Time Risk Analytics and Exposure Correlation
Security Hub calculates exposures in near real-time by correlating findings from Security Hub CSPM, Amazon Inspector, Amazon Macie, and Amazon GuardDuty.
Automatically correlates findings to identify when multiple security issues combine to create critical risk (e.g., public EC2 instance with vulnerabilities and misconfigurations).
Provides potential attack path visualization showing how attackers could access and control resources.
Enriches security signals with context by analyzing resource associations, potential impact, and relationships.
Exposure findings include contributing traits categorized as Reachability, Vulnerability, Sensitive data, Misconfiguration, and Assumability.
Provides prioritized remediation guidance with links to documentation.
Summary Dashboard and Historical Trends
Provides a Summary dashboard with customizable widgets showing exposures, threats, resources, and security coverage.
Trends feature provides up to 1 year of historical data for findings and resources across the organization.
Includes period-over-period analysis: day-over-day, week-over-week, and month-over-month comparisons.
Security coverage widget tracks which accounts and Regions have security services enabled, identifying visibility gaps.
Supports shared filters, finding filters, and resource filters with saved filter sets using and/or operators.
Automation Rules
Automation rules automatically update finding fields, suppress findings, and send findings to ticketing tools in near real-time.
Can automatically create tickets in Jira Service Management and ServiceNow based on criteria such as severity, resource type, or finding type.
Can be created from scratch or using pre-populated rule templates.
Supports automated response workflows through Amazon EventBridge to route findings to Lambda functions or AWS Systems Manager Automation runbooks.
Central Configuration
Allows centralized management of Security Hub across multiple accounts from a delegated administrator account.
Enables setting policies that specify whether Security Hub should be enabled and which standards and controls should be activated.
Policies can be applied to specific accounts, organizational units (OUs), or the entire organization.
Cross-Region Aggregation
Aggregates findings, finding updates, insights, control compliance statuses, security scores, and trends from multiple AWS Regions into a single home Region.
Can automatically link future Regions as they become available.
Supports GovCloud (US) regions.
Delegated administrator accounts see data for both administrator and member accounts.
Consolidated Controls and Findings
Provides a consolidated controls view showing compliance status across all enabled standards.
Generates a single finding per security check per resource, reducing duplicate findings across standards.
Controls are organized by unique control IDs rather than by standard.
Multicloud Security Operations (2026)
AWS Security Hub is expanding to unify security operations across multicloud environments.
Extended plan enables protection across AWS, Azure, GCP, OCI, and on-premises environments through curated partner solutions.
Provides unified procurement, billing, and operations across security vendors.
Automation: Amazon EventBridge, AWS Lambda, AWS Systems Manager Automation, Tines
Data/Schema: OCSF format for partner integrations; ASFF for Security Hub CSPM control findings
Partner Ecosystem (Extended Plan): 21+ partners across endpoint, identity, email, network, data, browser, cloud, AI, and security operations categories
AWS Certification Exam Practice Questions
Questions are collected from Internet and the answers are marked as per my knowledge and understanding (which might differ with yours).
AWS services are updated everyday and both the answers and questions might be outdated soon, so research accordingly.
AWS exam questions are not updated to keep up the pace with AWS updates, so even if the underlying feature has changed the question might not be updated
Open to further feedback, discussion and correction.
A security engineer has been asked to continuously monitor the company’s AWS account using automated compliance checks based on AWS best practices and Center for Internet Security (CIS) AWS Foundations Benchmarks. How can the security engineer accomplish this using AWS services?
AWS Config + AWS Security Hub
Amazon Inspector + AWS GuardDuty
Amazon Inspector + AWS Shield
AWS Config + Amazon Inspector
A company wants to unify its security operations across multiple AWS accounts and automatically correlate findings from threat detection, vulnerability management, and security posture services. Which AWS service provides this unified security operations experience?
Amazon GuardDuty
Amazon Inspector
AWS Security Hub
AWS Config
A security team needs to identify their most critical security risks by understanding when multiple security issues (vulnerabilities, misconfigurations, and threats) combine to create exploitable exposures. Which Security Hub feature provides this capability?
Security standards
Automation rules
Near real-time risk analytics and exposure correlation
Cross-Region aggregation
An organization wants to consolidate billing for Amazon Inspector vulnerability scanning, Security Hub CSPM posture management, and risk analytics into a single predictable pricing model. Which Security Hub plan should they use?
Extended plan
Threat Analytics add-on
Essentials plan
Standard plan
A multinational company operates across 10 AWS Regions and wants to view all security findings from a single location without manually checking each region. Which Security Hub feature should they enable?
Central configuration
Automation rules
Cross-Region aggregation
Delegated administrator
A company wants to extend its AWS Security Hub protection to cover endpoint security, identity management, and email security across both AWS and other cloud providers. Which Security Hub offering should they use?
Security Hub Essentials plan
Security Hub CSPM
Security Hub Threat Analytics
Security Hub Extended plan
Which of the following accurately describes the relationship between AWS Security Hub and AWS Security Hub CSPM?
They are the same service with different names
Security Hub CSPM is a newer replacement for Security Hub
Security Hub CSPM focuses on posture management and best practice checks, while Security Hub provides unified security operations with risk correlation
Security Hub is only for threat detection while CSPM handles all other security functions
Amazon GuardDuty is a threat detection service that continuously monitors the AWS accounts and workloads for malicious activity and delivers detailed security findings for visibility and remediation.
is a continuous security monitoring service that analyzes and processes the following foundational data sources:
Runtime activity from container workloads (Amazon EKS, Amazon ECS including Fargate, and Amazon EC2 instances).
uses threat intelligence feeds, such as lists of malicious IP addresses and domains, and machine learning to identify unexpected and potentially unauthorized and malicious activity within the AWS environment.
combines machine learning, anomaly detection, network monitoring, and malicious file discovery, utilizing both AWS-developed and industry-leading third-party sources to help protect workloads and data on AWS.
uses artificial intelligence (AI), machine learning (ML), and anomaly detection using both AWS and industry-leading threat intelligence to help protect AWS accounts, workloads, and data.
is a Regional service and is recommended to be enabled in all supported AWS Regions. This helps generate findings of unauthorized or unusual activity even in Regions not actively used.
does not look at historical data, it monitors only the activity that starts after it is enabled.
operates completely independent of the AWS resources and therefore has no impact on the performance or availability of the accounts or workloads.
GuardDuty supports
Suppression rules, allow the creation of very specific combinations of attributes to suppress findings. Supports wildcards (* and ?) and filtering on any finding field.
Trusted Entity Lists (previously Trusted IP Lists) for highly secure communication with the AWS environment. Now supports both IP addresses and domain names. Findings are not generated based on trusted entity lists.
Threat Entity Lists (previously Threat Lists) for known malicious IP addresses and domain names. Findings are generated based on threat entity lists.
Security findings are retained and made available through the GuardDuty console and APIs for 90 days, after which they are discarded.
Findings are assigned a severity (Critical, High, Medium, Low), and actions can be automated by integrating with Security Hub, EventBridge, Lambda, and Step Functions.
Amazon Detective is also tightly integrated with GuardDuty which helps perform deeper forensic and root cause investigations.
GuardDuty supports AWS PrivateLink (VPC endpoints) for private connectivity without traversing the public internet.
offers a 30-day free trial. After the free trial ends, cost is based on the volume of data analyzed.
GuardDuty Protection Plans
GuardDuty offers multiple protection plans that can be independently enabled or disabled:
Foundational GuardDuty – Core threat detection that cannot be disabled. Monitors CloudTrail management events, VPC Flow Logs, and DNS logs.
S3 Protection – Monitors Amazon S3 data events for potential threats to data, such as data exfiltration and destruction.
Runtime Monitoring – Monitors operating system-level events for EKS, ECS, and EC2 workloads using a GuardDuty security agent.
EKS Audit Logs – Monitors Amazon EKS audit logs for potential threats to Kubernetes clusters.
RDS Protection – Monitors RDS login activity for potential threats to databases. Supports Aurora MySQL, Aurora PostgreSQL (including Limitless Database), and RDS for PostgreSQL.
Lambda Protection – Monitors Lambda function network activity for potential threats.
Each protection plan can be auto-enabled for new AWS Organizations accounts.
GuardDuty offers the flexibility to customize how new accounts inherit protection plans.
GuardDuty Extended Threat Detection
Introduced at AWS re:Invent 2024, Extended Threat Detection automatically detects multi-stage attacks that span data sources, multiple types of AWS resources, and time within an AWS account.
Uses sophisticated AI/ML algorithms trained at AWS scale to automatically correlate security signals and detect critical threats.
Enabled automatically for all GuardDuty accounts at no additional cost.
Correlates multiple events (called “Signals”) including API activities and GuardDuty findings to identify attack sequences.
Can detect weak signals that individually don’t present as clear threats but when combined reveal suspicious activity patterns.
Operates within a 24-hour rolling time window to detect in-progress or recent attacks.
All attack sequence findings are assigned Critical severity.
Attack sequence finding types include:
AttackSequence:S3/CompromisedData – Detects credential misuse leading to S3 data compromise.
AttackSequence:IAM/CompromisedCredentials – Detects multi-stage attacks using compromised IAM credentials.
Enabling additional protection plans (S3 Protection, EKS Protection, Runtime Monitoring) widens the range of event sources and enables more comprehensive attack sequence detection.
GuardDuty Runtime Monitoring
Runtime Monitoring uses a lightweight GuardDuty security agent that adds visibility into runtime behavior including file access, process execution, command line arguments, and network connections.
Supports three resource types:
Amazon EKS – Uses an EKS add-on (aws-guardduty-agent) deployed on EKS clusters.
Amazon ECS (Fargate) – Monitors ECS workloads running on Fargate.
Amazon EC2 – Monitors EC2 instances using SSM-based agent deployment (GA March 2024).
Supports automated agent configuration that permits GuardDuty to install and manage the security agent automatically.
Supports inclusion/exclusion tags to control which resources get the security agent.
Detects threats such as crypto-mining, malicious file execution, suspicious shell creation, privilege escalation, reverse shells, and defense evasion techniques.
Supports Amazon EKS Auto Mode.
GuardDuty with Multiple Accounts
GuardDuty has multi-account management through AWS Organizations integration, which allows delegating an administrator account for the organization.
The delegated administrator (DA) account is a centralized account that consolidates all findings and can configure all member accounts.
Supports up to 50,000 member accounts through AWS Organizations (including up to 5,000 by invitation).
All security findings are aggregated to the administrator account for review and remediation.
EventBridge events are also aggregated to the administrator account.
Organization configuration allows auto-enabling GuardDuty and protection plans for ALL accounts, new accounts only, or no auto-enable.
GuardDuty Automated Remediation
GuardDuty security findings can be remediated automatically using EventBridge and AWS Lambda.
For example, a Lambda function can be created to modify the AWS security group rules based on security findings. For a GuardDuty finding indicating one of your EC2 instances is being probed by a known malicious IP, the address can be added through an EventBridge rule, initiating a Lambda function to automatically modify the security group rules and restrict access on that port.
Findings are exported to Amazon S3 for long-term storage and analysis.
Integrates with AWS Security Incident Response for automated triage and investigation.
GuardDuty Malware Protection
GuardDuty Malware Protection includes three capabilities:
Malware Protection for EC2
Scans EBS volumes attached to EC2 instances and container workloads for malware.
Creates a replica EBS volume from a snapshot and scans it for trojans, worms, crypto miners, rootkits, bots, and more.
Supports two scan types:
GuardDuty-initiated – Automatically triggered when certain GuardDuty findings are generated.
On-demand – Manually initiated by providing the EC2 instance ARN.
Supports scanning EBS volumes up to 2048 GB.
Supports scanning EBS volumes encrypted with AWS managed keys.
Supports Amazon EKS Auto Mode managed instances.
Malware Protection for S3
Launched June 2024, provides built-in malware scanning for objects uploaded to designated S3 buckets.
Automatically scans newly uploaded objects using multiple AWS-developed and industry-leading third-party malware scanning engines.
Supports on-demand scanning of existing S3 objects via the SendObjectMalwareScan API (November 2025).
Supports scanning objects up to 100 GB (increased from 5 GB in July 2025).
Publishes scan results to EventBridge for downstream workflows (e.g., quarantine to a separate bucket).
Can add tags to scanned objects indicating scan status.
GuardDuty automatically updates malware signatures every 15 minutes.
Malware Protection for AWS Backup
Launched November 2025, detects the potential presence of malware in backup resources.
Scans AWS Backup-protected resources including Amazon EBS snapshots, EC2 AMIs, and Amazon S3 Recovery Points.
Supports full and incremental scans.
Helps identify the last known clean backup for recovery.
Can automate malware scanning across the entire organization.
GuardDuty AI Workload Protection
Launched August 2024, GuardDuty foundational threat detection and Lambda Protection help detect threats to AI workloads built on AWS.
Detects when Amazon Bedrock model invocation logging is disabled (DefenseEvasion:IAMUser/BedrockLoggingDisabled finding type, November 2025).
Monitors for unauthorized access to AI/ML resources and data exfiltration attempts.
GuardDuty Custom Threat Detection
GuardDuty introduced custom Entity Lists (August 2025) that support both IP addresses and domain names for custom threat detection.
Replaces the legacy IP-only threat lists with more comprehensive entity-based lists.
Supports:
Trusted Entity Lists – IP addresses and domain names to suppress findings.
Threat Entity Lists – Known malicious IP addresses and domain names to generate findings.
Only the GuardDuty administrator account can manage entity lists; settings apply automatically to member accounts.
GuardDuty recommends using entity lists over the legacy IP address lists.
AWS Certification Exam Practice Questions
Questions are collected from Internet and the answers are marked as per my knowledge and understanding (which might differ with yours).
AWS services are updated everyday and both the answers and questions might be outdated soon, so research accordingly.
AWS exam questions are not updated to keep up the pace with AWS updates, so even if the underlying feature has changed the question might not be updated
Open to further feedback, discussion and correction.
Which AWS service makes detecting and reporting unexpected and potentially malicious activity in your AWS environment easy?
AWS Shield
AWS Inspector
AWS GuardDuty
AWS WAF
A company needs to detect multi-stage attacks that span multiple AWS services and resources over time. Which GuardDuty capability should they rely on?
GuardDuty Malware Protection
GuardDuty Runtime Monitoring
GuardDuty Extended Threat Detection
GuardDuty RDS Protection
Which GuardDuty protection plan monitors operating system-level events on container and EC2 workloads? (Select TWO)
Runtime Monitoring
S3 Protection
Lambda Protection
EKS Audit Logs
Malware Protection for EC2
A company wants to scan S3 objects for malware when they are uploaded to a bucket. Which GuardDuty feature should they enable?
GuardDuty Malware Protection for EC2
GuardDuty Malware Protection for S3
GuardDuty S3 Protection
GuardDuty Extended Threat Detection
What severity level do GuardDuty Extended Threat Detection attack sequence findings receive?
High
Critical
Medium
Varies based on the attack type
A security team wants to add their own threat intelligence containing both malicious domains and IP addresses to GuardDuty. What should they use?
⚠️ AWS Data Pipeline – Maintenance Mode (No Longer Available to New Customers)
AWS closed new customer access to AWS Data Pipeline effective July 25, 2024. The service is now in maintenance mode — no new features or region expansions are planned.
Existing customers can continue to use the service as normal, but AWS recommends migrating to modern alternatives.
Recommended Migration Alternatives:
AWS Glue – Serverless data integration service for ETL, Apache Spark applications, and data orchestration with visual editors and notebooks.
AWS Step Functions – Serverless orchestration service for building workflows integrating 250+ AWS services with visual designer and JSON-based workflow definitions.
Amazon MWAA – Managed Apache Airflow service for end-to-end data pipeline orchestration with Python-based DAGs and 1,000+ pre-built operators.
AWS Data Pipeline is a web service that makes it easy to automate and schedule regular data movement and data processing activities in AWS
helps define data-driven workflows
integrates with on-premises and cloud-based storage systems
helps quickly define a pipeline, which defines a dependent chain of data sources, destinations, and predefined or custom data processing activities
supports scheduling where the pipeline regularly performs processing activities such as distributed data copy, SQL transforms, EMR applications, or custom scripts against destinations such as S3, RDS, or DynamoDB.
ensures that the pipelines are robust and highly available by executing the scheduling, retry, and failure logic for the workflows as a highly scalable and fully managed service.
AWS Data Pipeline features
Distributed, fault-tolerant, and highly available
Managed workflow orchestration service for data-driven workflows
Infrastructure management service, as it will provision and terminate resources as required
Provides dependency resolution
Can be scheduled
Supports Preconditions for readiness checks.
Grants control over retries, including frequency and number
Native integration with S3, DynamoDB, RDS, EMR, EC2 and Redshift
Support for both AWS based and external on-premise resources
AWS Data Pipeline Concepts
Pipeline Definition
Pipeline definition helps the business logic to be communicated to the AWS Data Pipeline
Pipeline definition defines the location of data (Data Nodes), activities to be performed, the schedule, resources to run the activities, per-conditions, and actions to be performed
Pipeline Components, Instances, and Attempts
Pipeline components represent the business logic of the pipeline and are represented by the different sections of a pipeline definition.
Pipeline components specify the data sources, activities, schedule, and preconditions of the workflow
When AWS Data Pipeline runs a pipeline, it compiles the pipeline components to create a set of actionable instances and contains all the information needed to perform a specific task
Data Pipeline provides durable and robust data management as it retries a failed operation depending on frequency & defined number of retries
Task Runners
A task runner is an application that polls AWS Data Pipeline for tasks and then performs those tasks
When Task Runner is installed and configured,
it polls AWS Data Pipeline for tasks associated with activated pipelines
after a task is assigned to Task Runner, it performs that task and reports its status back to Pipeline.
A task is a discreet unit of work that the Pipeline service shares with a task runner and differs from a pipeline, which defines activities and resources that usually yields several tasks
Tasks can be executed either on the AWS Data Pipeline managed or user-managed resources.
Data Nodes
Data Node defines the location and type of data that a pipeline activity uses as source (input) or destination (output)
supports S3, Redshift, DynamoDB, and SQL data nodes
Databases
supports JDBC, RDS, and Redshift database
Activities
An activity is a pipeline component that defines the work to perform
Data Pipeline provides pre-defined activities for common scenarios like sql transformation, data movement, hive queries, etc
Activities are extensible and can be used to run own custom scripts to support endless combinations
Preconditions
Precondition is a pipeline component containing conditional statements that must be satisfied (evaluated to True) before an activity can run
A pipeline supports
System-managed preconditions
are run by the AWS Data Pipeline web service on your behalf and do not require a computational resource
Includes source data and keys check for e.g. DynamoDB data, table exists or S3 key exists or prefix not empty
User-managed preconditions
run on user defined and managed computational resources
Can be defined as Exists check or Shell command
Resources
A resource is a computational resource that performs the work that a pipeline activity specifies
supports AWS Data Pipeline-managed and self-managed resources
AWS Data Pipeline-managed resources include EC2 and EMR, which are launched by the Data Pipeline service only when they’re needed
Self managed on-premises resources can also be used, where a Task Runner package is installed which continuously polls the AWS Data Pipeline service for work to perform
Resources can run in the same region as their working data set or even on a region different than AWS Data Pipeline
Resources launched by AWS Data Pipeline are counted within the resource limits and should be taken into account
Actions
Actions are steps that a pipeline takes when a certain event like success, or failure occurs.
Pipeline supports SNS notifications and termination action on resources
Migration to Modern Alternatives
AWS recommends migrating existing Data Pipeline workloads to one of the following services based on your use case:
Migrate to AWS Glue
Best for serverless ETL workloads, Apache Spark-based processing, and data integration
Supports visual editors, notebooks, and crawlers for data discovery
Natively supports DynamoDB export/import (common Data Pipeline use case)
Includes data quality, sensitive data detection, and Data Catalog capabilities
Ideal when migrating pipelines built from pre-defined Data Pipeline templates (e.g., DynamoDB to S3 export)
Migrate to AWS Step Functions
Best for orchestrating multi-service workflows with visual designer
Integrates with 250+ AWS services and 11,000+ actions out-of-the-box
Uses Amazon States Language (JSON-based), similar to Data Pipeline’s JSON definitions
Cost-effective with per-task granularity pricing
Supports on-premises resources via AWS Systems Manager Run Command
Ideal for workloads requiring EC2, EMR, or Lambda orchestration
Migrate to Amazon MWAA (Managed Apache Airflow)
Best for complex workflow orchestration using Python-based DAGs
Provides 1,000+ pre-built operators covering AWS and non-AWS services
Rich UI for observability, restarts, backfills, and lineage tracking
Fully managed, open source (Apache Airflow) for maximum portability
Ideal for teams already using Airflow or needing advanced orchestration features
AWS Certification Exam Practice Questions
Questions are collected from Internet and the answers are marked as per my knowledge and understanding (which might differ with yours).
AWS services are updated everyday and both the answers and questions might be outdated soon, so research accordingly.
AWS exam questions are not updated to keep up the pace with AWS updates, so even if the underlying feature has changed the question might not be updated
Open to further feedback, discussion and correction.
Note: AWS Data Pipeline is in maintenance mode and unlikely to appear on newer exam versions. However, questions about data orchestration concepts may reference modern alternatives like AWS Glue, Step Functions, or Amazon MWAA.
An International company has deployed a multi-tier web application that relies on DynamoDB in a single region. For regulatory reasons they need disaster recovery capability in a separate region with a Recovery Time Objective of 2 hours and a Recovery Point Objective of 24 hours. They should synchronize their data on a regular basis and be able to provision the web application rapidly using CloudFormation. The objective is to minimize changes to the existing web application, control the throughput of DynamoDB used for the synchronization of data and synchronize only the modified elements. Which design would you choose to meet these requirements?
Use AWS data Pipeline to schedule a DynamoDB cross region copy once a day. Create a ‘Lastupdated’ attribute in your DynamoDB table that would represent the timestamp of the last update and use it as a filter. (Refer Blog Post)
Use EMR and write a custom script to retrieve data from DynamoDB in the current region using a SCAN operation and push it to DynamoDB in the second region. (No Schedule and throughput control)
Use AWS data Pipeline to schedule an export of the DynamoDB table to S3 in the current region once a day then schedule another task immediately after it that will import data from S3 to DynamoDB in the other region. (With AWS Data pipeline the data can be copied directly to other DynamoDB table)
Send each item into an SQS queue in the second region; use an auto-scaling group behind the SQS queue to replay the write in the second region. (Not Automated to replay the write)
Note: For new implementations, consider DynamoDB Global Tables for cross-region replication, or AWS Glue for scheduled ETL workloads.
Your company produces customer commissioned one-of-a-kind skiing helmets combining nigh fashion with custom technical enhancements. Customers can show off their Individuality on the ski slopes and have access to head-up-displays, GPS rear-view cams and any other technical innovation they wish to embed in the helmet. The current manufacturing process is data rich and complex including assessments to ensure that the custom electronics and materials used to assemble the helmets are to the highest standards. Assessments are a mixture of human and automated assessments you need to add a new set of assessment to model the failure modes of the custom electronics using GPUs with CUD across a cluster of servers with low latency networking. What architecture would allow you to automate the existing process using a hybrid approach and ensure that the architecture can support the evolution of processes over time?
Use AWS Data Pipeline to manage movement of data & meta-data and assessments. Use an auto-scaling group of G2 instances in a placement group. (Involves mixture of human assessments)
Use Amazon Simple Workflow (SWF) to manage assessments, movement of data & meta-data. Use an autoscaling group of G2 instances in a placement group. (Human and automated assessments with GPU and low latency networking)
Use Amazon Simple Workflow (SWF) to manage assessments movement of data & meta-data. Use an autoscaling group of C3 instances with SR-IOV (Single Root I/O Virtualization). (C3 and SR-IOV won’t provide GPU as well as Enhanced networking needs to be enabled)
Use AWS data Pipeline to manage movement of data & meta-data and assessments use auto-scaling group of C3 with SR-IOV (Single Root I/O virtualization). (Involves mixture of human assessments)
Note: For modern implementations, AWS Step Functions has largely replaced SWF for workflow orchestration including human-in-the-loop tasks. Current GPU instances include P4, P5, and G5 families.
AWS Lake Formation easily creates secure data lakes, making data available for wide-ranging analytics.
is an integrated data lake service that helps to discover, ingest, clean, catalog, transform, and secure data and make it available for analysis and ML.
automatically manages access to the registered data in S3 through services including AWS Glue, Athena, Redshift, QuickSight, and EMR to ensure compliance with your defined policies.
helps configure and manage your data lake without manually integrating multiple underlying AWS services.
can manage data ingestion through AWS Glue. Data is automatically classified, and relevant data definitions, schema, and metadata are stored in the central Glue Data Catalog. Once the data is in the S3 data lake, access policies, including table-and-column-level access controls can be defined, and encryption for data at rest enforced.
uses a shared infrastructure with AWS Glue, including console controls, ETL code creation and job monitoring, blueprints to create workflows for data ingest, the same data catalog, and a serverless architecture.
integrates with IAM so authenticated users and roles can be automatically mapped to data protection policies that are stored in the data catalog. The IAM integration also supports Microsoft Active Directory or LDAP to federate into IAM using SAML.
helps centralize data access policy controls. Users and roles can be defined to control access, down to the table and column level.
supports private endpoints in the VPC and records all activity in AWS CloudTrail for network isolation and auditability.
is part of the Amazon SageMaker Lakehouse architecture (announced at re:Invent 2024), which unifies data across S3 data lakes, S3 Tables, and Redshift data warehouses with consistent Lake Formation permissions across all analytics and ML engines.
Lake Formation Fine-Grained Access Control (FGAC)
Lake Formation provides fine-grained access control at database, table, column, row, and cell levels.
Column-Level Security – restrict access to specific columns within a table.
Row-Level Security – define data filters with row filter expressions to restrict rows returned in query results.
Cell-Level Security – combine column-level and row-level security using data cell filters to restrict access at the cell level.
Data filters define both the columns that a user has access to and the rows that match a filter expression.
Fine-grained permissions are enforced across Athena, Redshift Spectrum, EMR, and AWS Glue ETL jobs.
Supports Open Table Formats (OTFs) including Apache Iceberg, Apache Hudi, and Delta Lake with table, row, column, and cell-level permissions.
Lake Formation Tag-Based Access Control (LF-TBAC)
LF-TBAC provides a scalable way to manage permissions using LF-Tags (key-value pairs) assigned to Data Catalog resources.
Instead of defining policies per named resource, data stewards create LF-Tags based on business needs and attach them to databases, tables, and columns.
Permissions are granted to principals based on matching LF-Tags, enabling automatic access as new resources are tagged.
Supports cross-account data sharing using AWS Resource Access Manager (RAM).
LF-Tag Expressions (Nov 2024) – save and reuse LF-Tag expressions to grant permissions on Data Catalog resources, reducing policy management overhead.
Supports tag-based access control for federated catalogs including Amazon S3 Tables, Amazon Redshift data warehouses, and federated data sources (DynamoDB, SQL Server, Snowflake).
Lake Formation Attribute-Based Access Control (ABAC)
(April 2025) – Lake Formation allows granting permissions to principals with matching attributes on Data Catalog resources.
Extends beyond tag-based controls to match principal attributes for fine-grained authorization.
Lake Formation Hybrid Access Mode
(September 2023) – provides flexibility to selectively enable Lake Formation permissions for specific databases and tables in the Data Catalog.
Both Lake Formation permissions and IAM permissions can control access to the same data simultaneously.
Opted-in principals require both Lake Formation permissions and IAM permissions, while non-opted-in principals continue accessing data using only IAM permissions.
Enables incremental migration to Lake Formation without interrupting existing users or workloads.
Integrates with Amazon DataZone (April 2024) – allows publishing and sharing Glue tables through DataZone without requiring prior Lake Formation registration.
Lake Formation Cross-Account Data Sharing
Share Data Catalog databases and tables across AWS accounts within or outside an AWS Organization.
Share with entire AWS accounts or directly with IAM principals in another account.
Supports cross-account sharing using both tag-based access control and named resource methods.
Uses AWS Resource Access Manager (RAM) for cross-account grants.
(Feb 2026) – Enhanced cross-account sharing allows sharing hundreds of thousands of tables across accounts for multi-account analytics environments at scale.
RetainSharingOnAccountLeaveOrganization parameter – keeps resource shares in place when accounts change organizations.
Enables building a data mesh architecture with producer accounts, central governance accounts, and consumer accounts.
Lake Formation Credential Vending
Provides temporary credentials to users, services, or applications for short-term access to Amazon S3 data.
Supports integration with third-party services and engines through credential vending API operations.
(June 2026) – Lake Formation extends table permissions to access underlying data files in S3 directly, using the GetTemporaryDataLocationCredentials() API.
Provides a single set of permissions for both SQL queries and direct file access using existing Lake Formation table grants.
Eliminates the need to maintain separate S3 bucket policies or IAM role policies for file-level access.
Supports auditable credential vending with IAM Identity Center user context in CloudTrail events (July 2024).
Lake Formation Multi-Catalog and Federated Catalogs
(December 2024) – AWS Glue Data Catalog allows creating federated catalogs to unify data across:
Amazon S3 data lakes
Amazon Redshift data warehouses
Operational databases (Amazon DynamoDB)
Third-party data sources (Snowflake, MySQL, etc.)
Lake Formation permissions apply consistently across all federated catalogs.
New permissions added: CREATE_CATALOG and SUPER_USER for catalog-level access control.
Lake Formation with Amazon S3 Tables
(March 2025) – S3 Tables can be integrated and cataloged as AWS Glue Data Catalog objects and registered as Lake Formation data locations.
Enables Lake Formation governance over S3 Tables using the same permission model as standard data lake tables.
Supports building cross-account data mesh architectures with S3 Tables where producer, governance, and consumer accounts operate independently.
Lake Formation with Open Table Formats
Supports managing access permissions for Apache Iceberg, Apache Hudi, and Delta Lake tables.
Enforces table, row, column, and cell-level permissions on OTF-based tables.
Apache Iceberg has the best integration with AWS Glue ETL via Lake Formation permissions, including full SQL support.
AWS Glue Data Catalog provides managed compaction for Iceberg tables to improve query performance.
Supports catalog federation for remote Apache Iceberg tables stored in external Iceberg catalogs.
Governed Tables (Deprecated)
⚠️ DEPRECATED: Lake Formation Governed Tables were deprecated effective December 31, 2024. All Governed Table APIs stopped working after February 17, 2025.
Migration: AWS recommends using open source transactional table formats — Apache Iceberg (recommended), Apache Hudi, or Delta Lake — which provide ACID transactions, time-travel queries, and automatic compaction natively.
Governed Tables previously provided ACID transactions, automatic data compaction, and time-travel queries within Lake Formation.
These capabilities are now fully supported through Apache Iceberg tables in the AWS Glue Data Catalog.
Lake Formation Blueprints and Workflows
Blueprints define the source data target and schedule for loading data into the data lake.
Lake Formation executes and tracks a workflow as a single entity.
Supports both on-demand and scheduled workflow execution.
Workflows are visible in the Glue console as a directed acyclic graph (DAG).
Blueprint types include Database Snapshot and Incremental Database.
Lake Formation Data Catalog Views
(November 2023) – create views in the AWS Glue Data Catalog that reference up to 10 tables.
Views can be created using SQL editors for Athena or Redshift, or via AWS Glue APIs (August 2024).
Lake Formation permissions can be applied to views for fine-grained access control.
Lake Formation Cross-Region Data Access
Supports querying Data Catalog tables across AWS Regions.
Access data in other Regions using Athena, EMR, and AWS Glue ETL by creating resource links pointing to source databases and tables.
Lake Formation Integration with IAM Identity Center
(November 2023) – integrates with IAM Identity Center for workforce identity federation.
Users and groups managed in Identity Center can access Data Catalog resources with Lake Formation permissions enforced.
Supports trusted identity propagation for analytics queries.
Lake Formation Key Integrations
Amazon SageMaker Lakehouse – unified lakehouse architecture with Lake Formation as the governance layer for all analytics and ML workloads.
Amazon DataZone – data management service that uses Lake Formation for access control and governance when sharing data assets.
Amazon Athena – serverless queries with Lake Formation FGAC enforced.
Amazon Redshift / Redshift Spectrum – data sharing governed by Lake Formation permissions and LF-Tags.
Amazon EMR – Spark, Hive, and Presto jobs with table, row, column, and cell-level security via Lake Formation.
AWS Glue ETL – fine-grained access control enforced in ETL jobs.
Amazon QuickSight – BI dashboards with Lake Formation permissions.
Amazon SageMaker Feature Store – supports fine-grained access control through Lake Formation for ML feature pipelines.
AWS Certification Exam Practice Questions
Questions are collected from Internet and the answers are marked as per my knowledge and understanding (which might differ with yours).
AWS services are updated everyday and both the answers and questions might be outdated soon, so research accordingly.
AWS exam questions are not updated to keep up the pace with AWS updates, so even if the underlying feature has changed the question might not be updated
Open to further feedback, discussion and correction.
A company needs to centrally manage fine-grained access control for its data lake stored in Amazon S3. Data analysts should only see rows relevant to their department when querying tables via Amazon Athena. Which approach should be used?
Create separate S3 buckets per department and use S3 bucket policies
Use AWS Lake Formation data filters with row-level security expressions
Create separate Athena workgroups with IAM policies per department
Use S3 Access Points with different policies per department
A data engineering team wants to migrate to Lake Formation for permission management but cannot disrupt existing workloads that use IAM-based access to Glue Data Catalog tables. Which feature should they use?
Lake Formation tag-based access control
Lake Formation hybrid access mode
Lake Formation credential vending
Lake Formation cross-account sharing
An organization has 50 analytics teams across 20 AWS accounts that need to share and govern hundreds of thousands of tables centrally. Which Lake Formation capability best supports this at scale?
S3 bucket policies with cross-account access
Lake Formation cross-account data sharing with LF-Tag-based access control
AWS RAM resource shares without Lake Formation
IAM roles with assume-role policies per account
A company uses Apache Iceberg tables stored in Amazon S3 and needs to enforce column-level and cell-level security for different user groups querying via Athena and EMR. Which service provides this capability?
S3 Access Grants
AWS Glue Data Quality
AWS Lake Formation with data cell filters
Amazon Macie with data classification
A data science team needs to access the underlying S3 data files directly for an ML training pipeline, but the tables are governed by Lake Formation permissions. Previously they had to maintain separate S3 bucket policies. Which new feature eliminates this overhead?
S3 Access Points
Lake Formation credential vending with GetTemporaryDataLocationCredentials API
IAM Identity Center direct S3 access
AWS Glue Data Catalog resource policies
A company previously used Lake Formation Governed Tables for ACID transactions in their data lake. After the deprecation in December 2024, which is the AWS-recommended replacement? (Select TWO)
Amazon DynamoDB transactions
Apache Iceberg tables in the Glue Data Catalog
Amazon Aurora with S3 export
Apache Hudi tables with Lake Formation permissions
Amazon Redshift Serverless
Show Answer
Answers: –
B – Lake Formation data filters support row-level security to restrict rows returned based on filter expressions.
B – Hybrid access mode allows selective enablement of Lake Formation permissions without disrupting existing IAM-based access.
B – LF-TBAC with cross-account sharing scales to hundreds of thousands of tables across multiple accounts.
C – Lake Formation supports fine-grained access control (including cell-level security) for Apache Iceberg and other open table formats.
B – The GetTemporaryDataLocationCredentials API vends temporary credentials scoped to S3 locations, providing unified permissions for both SQL queries and direct file access.
B, D – AWS recommends migrating to open table formats (Apache Iceberg preferred, Hudi also supported) which provide ACID transactions natively with Lake Formation permission support.