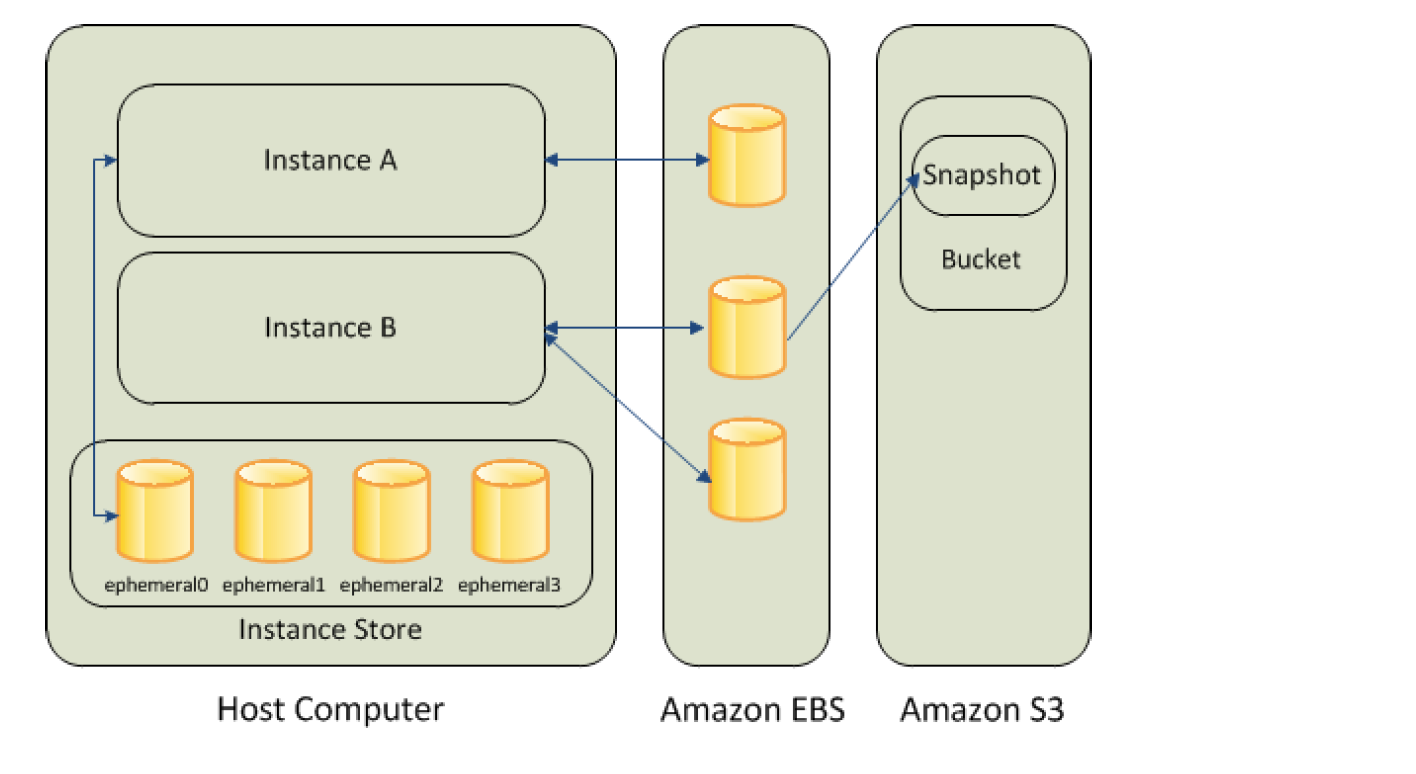
Elastic Block Store – EBS provides highly available, reliable, durable, block-level storage volumes that can be attached to an EC2 instance.
persists independently from the running life of an instance.
behaves like a raw, unformatted, external block device that can be attached to a single EC2 instance at a time.
is recommended for data that requires frequent and granular updates e.g. running a database or filesystem.
is Zonal and can be attached to any instance within the same Availability Zone and can be used like any other physical hard drive.
is particularly well-suited for use as the primary storage for file systems, databases, or any applications that require fine granular updates and access to raw, unformatted, block-level storage.
Instance store provides temporary or Ephemeral block-level storage
is located on the disks that are physically attached to the host computer.
consists of one or more instance store volumes exposed as block devices.
The size of an instance store varies by instance type.
Virtual devices for instance store volumes that are ephemeral[0-23], starting the first one as ephemeral0 and so on.
While an instance store is dedicated to a particular instance, the disk subsystem is shared among instances on a host computer.
is ideal for temporary storage of information that changes frequently, such as buffers, caches, scratch data, and other temporary content, or for data that is replicated across a fleet of instances, such as a load-balanced pool of web servers.
delivers very high random I/O performance and is a good option for storage with very low latency requirements, but you don’t need the data to persist when the instance terminates or you can take advantage of fault-tolerant architectures.
Elastic File Store – EFS provides a simple, fully managed, easy-to-set-up, scalable, serverless, and cost-optimized file storage
can automatically scale from gigabytes to petabytes of data without needing to provision storage.
provides managed NFS (network file system) that can be mounted on and accessed by multiple EC2 in multiple AZs simultaneously.
offers highly durable, highly scalable, and highly available.
stores data redundantly across multiple AZs in the same region
grows and shrinks automatically as files are added and removed, so there is no need to manage storage procurement or provisioning.
supports the Network File System version 4 (NFSv4.1 and NFSv4.0) protocol.
provides file system access semantics, such as strong data consistency and file locking.
is compatible with all Linux-based AMIs for EC2, POSIX file system (~Linux) that has a standard file API.
is a shared POSIX system for Linux systems and does not work for Windows.
offers the ability to encrypt data at rest using KMS and in transit.
can be accessed from on-premises using an AWS Direct Connect or AWS VPN connection between the on-premises datacenter and VPC.
can be accessed concurrently from servers in the on-premises data center as well as EC2 instances in the VPC.
Block Device Mapping
A block device is a storage device that moves data in sequences of bytes or bits (blocks) and supports random access and generally use buffered I/O for e.g. hard disks, CD-ROM etc
Block devices can be physically attached to a computer (like an instance store volume) or can be accessed remotely as if it was attached (like an EBS volume)
Block device mapping defines the block devices to be attached to an instance, which can either be done while creation of an AMI or when an instance is launched
Block device must be mounted on the instance, after being attached to the instance, to be able to be accessed
When a block device is detached from an instance, it is unmounted by the operating system and you can no longer access the storage device.
Additional Instance store volumes can be attached only when the instance is launched while EBS volumes can be attached to a running instance.
Viewing the block device mapping for an instance only shows the EBS volumes and not the instance store volumes. Instance metadata can be used to query the complete block device mapping.
Public Data Sets
Amazon Web Services provides a repository of public data sets that can be seamlessly integrated into AWS cloud-based applications.
Amazon stores the data sets at no charge to the community and, as with all AWS services, you pay only for the compute and storage you use for your own applications.
AWS Certification Exam Practice Questions
Questions are collected from Internet and the answers are marked as per my knowledge and understanding (which might differ with yours).
AWS services are updated everyday and both the answers and questions might be outdated soon, so research accordingly.
AWS exam questions are not updated to keep up the pace with AWS updates, so even if the underlying feature has changed the question might not be updated
Open to further feedback, discussion and correction.
When you view the block device mapping for your instance, you can see only the EBS volumes, not the instance store volumes.
Depends on the instance type
FALSE
Depends on whether you use API call
TRUE
Amazon EC2 provides a repository of public data sets that can be seamlessly integrated into AWS cloud-based applications. What is the monthly charge for using the public data sets?
A 1 time charge of 10$ for all the datasets.
1$ per dataset per month
10$ per month for all the datasets
There is no charge for using the public data sets
How many types of block devices does Amazon EC2 support?
Total amount of read and write operations (normalized to 256K capacity units) consumed in a specified period of time
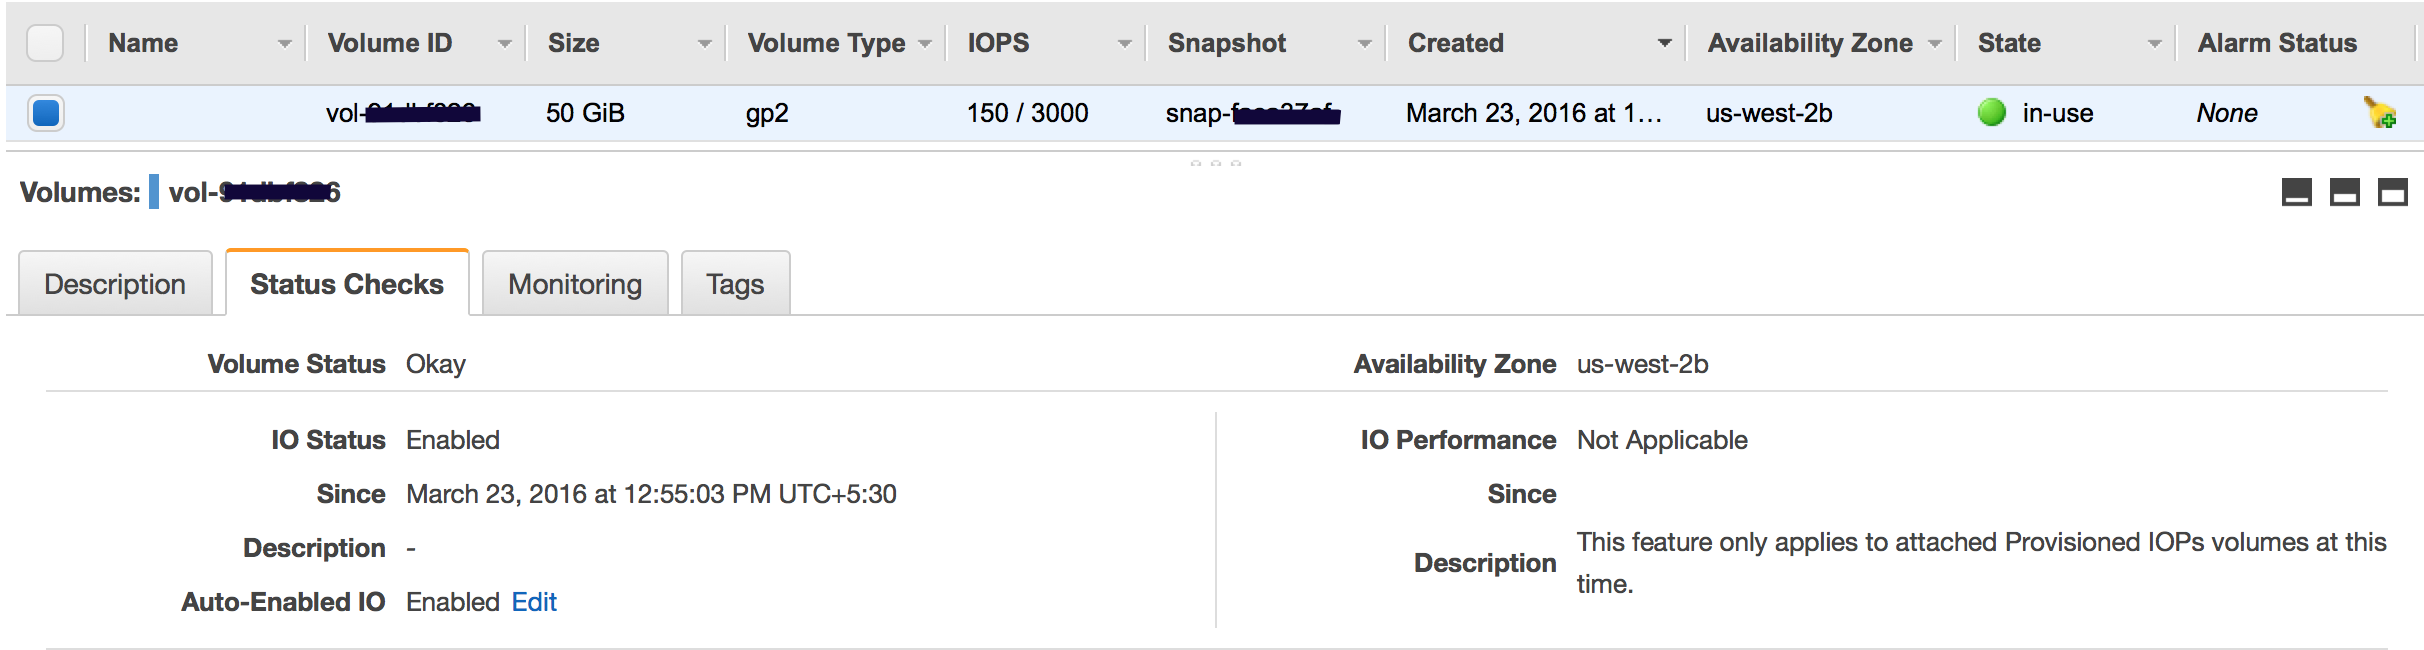
Volume Status Checks Monitoring
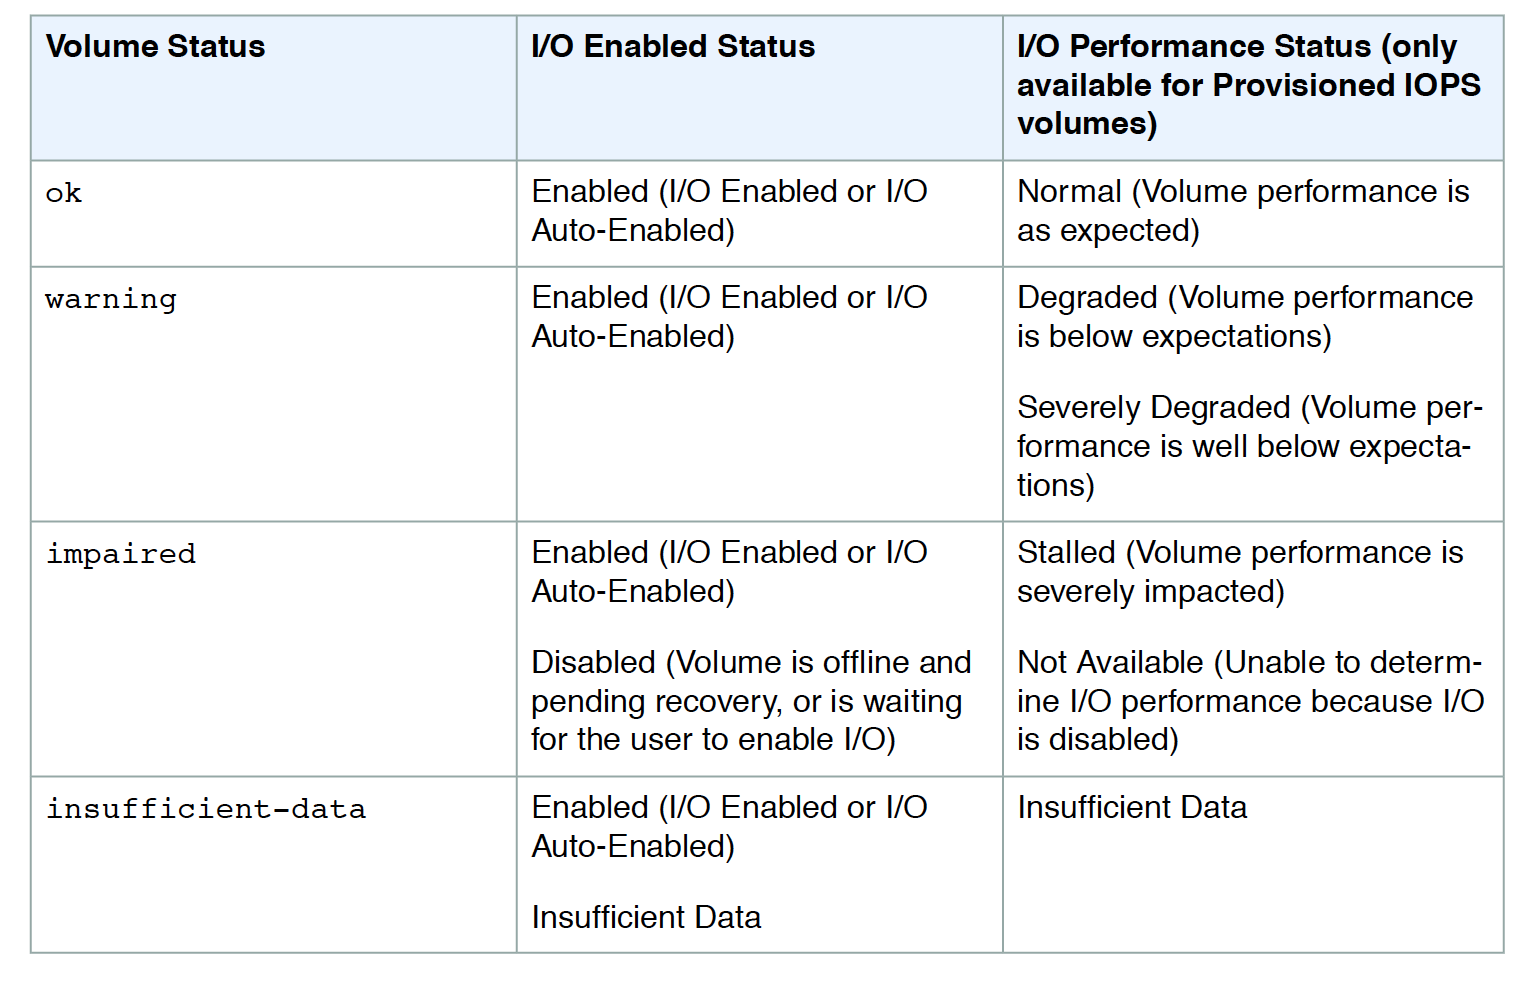
Volume status checks are automated tests that run every 5 minutes and return a pass or fail status.
Volume check status
Ok – all the status checks passed
Impaired – if the status checks failed
Insufficient-Data – checks are still in progress
Warning – the I/O performance of the volume is below expectations
When EBS determines the volume’s data is potentially inconsistent, it disables the I/O to the EBS volume from the attached EC2 instance to prevent any data corruption. This leads to the status check to fail and the volume status being impaired. Amazon waits for the I/O to be enabled, giving you an opportunity to perform consistency checks.
If the auto disabling of I/O is not needed, it can be overridden by enabling the Auto-Enabled IO flag, which would make the EBS volume auto-available immediately after the impaired status.
Events would be fired for notification whenever the I/O for an EBS volume is disabled
I/O performance status checks, applicable only for PIOPS (SSD) volumes, compare actual volume performance with the expected volume performance and alert if performing below expectations. Status check is performed every 1 min, however, is collected by CloudWatch every 5 mins.
While initializing Provisioned IOPS (SSD) volumes that were restored from snapshots, the performance of the volume may drop below 50 percent of its expected level, which causes the volume to display a warning state in the I/O Performance status check. This is expected and can be ignored.
Volume Events Monitoring
EBS generates events for volume status checks
Each event includes a start time that indicates the time at which the event occurred and a duration that indicates how long I/O for the volume was disabled
Events description can be Awaiting Action (to enable I/O), IO enabled, IO Auto-Enabled, or whether the status check resulted in Normal, Degraded, Severely Degraded, or stalled status
AWS Certification Exam Practice Questions
Questions are collected from Internet and the answers are marked as per my knowledge and understanding (which might differ with yours).
AWS services are updated everyday and both the answers and questions might be outdated soon, so research accordingly.
AWS exam questions are not updated to keep up the pace with AWS updates, so even if the underlying feature has changed the question might not be updated
Open to further feedback, discussion and correction.
A user has configured CloudWatch monitoring on an EBS backed EC2 instance. If the user has not attached any additional device, which of the below mentioned metrics will always show a 0 value?
DiskReadBytes
NetworkIn
NetworkOut
CPUUtilization
What does it mean if you have zero IOPS and a non-empty I/O queue for all EBS volumes attached to a running EC2 instance?
The I/O queue is buffer flushing.
Your EBS disk head(s) is/are seeking magnetic stripes.
The EBS volume is unavailable. (EBS volumes are unavailable when all of the attached volumes perform zero read write IO, with pending IO in the queue Refer link)
You need to re-mount the EBS volume in the OS.
While performing the volume status checks, if the status is insufficient-data, what does it mean?
⚠️ Important Update (2024): Starting mid-2024, all newly released Amazon EC2 instance types use IMDSv2 only by default. AWS strongly recommends migrating from IMDSv1 to IMDSv2 across all existing infrastructure. Amazon Linux 2023 enforces IMDSv2 by default with IMDSv1 disabled.
Instance metadata and user data can be used for Self Configuration allowing EC2 instances answer the question Who am I? What should I do?
Instance metadata and user data can be accessed from within the instance itself
Data is not protected by authentication or cryptographic methods. Anyone who can access the instance can view its metadata and should not be used to store any sensitive data, such as passwords, as user data.
Both the metadata and user data are available from the IP address 169.254.169.254 (IPv4) or fd00:ec2::254 (IPv6, on Nitro instances) and have the latest as well as previous versions available
Metadata and User data can be retrieved using simple curl or GET command and these requests are not billed
Instance Metadata
Instance metadata is data about the instance and allows you to get answers to the Who am I?
is divided into two categories
Instance metadata
includes metadata about the instance such as instance id, AMI id, hostname, IP address, role, etc
Can be accessed from http://169.254.169.254/latest/meta-data/
Dynamic data
is generated when the instances are launched such as instance identity documents, instance monitoring, etc
Can be accessed from http://169.254.169.254/latest/dynamic/
can be used for managing and configuring running instances
allows access to user data that specified when launching the instance
Instance Metadata Access Methods
Instance metadata can be accessed from a running instance using one of the following methods:
Instance Metadata Service Version 2 (IMDSv2) – a session-oriented method (Recommended)
Instance Metadata Service Version 1 (IMDSv1) – a request/response method (Legacy, being phased out)
By default, either IMDSv1 or IMDSv2, or both can be used on older instance types.
Starting mid-2024, all newly released EC2 instance types use IMDSv2 only by default.
Instance metadata service distinguishes between IMDSv1 and IMDSv2 requests based on whether, for any given request, either the PUT or GET headers, which are unique to IMDSv2, are present in that request.
Instance metadata service can be configured on each instance so that local code or users must use IMDSv2. When IMDSv2 is enforced, IMDSv1 no longer works.
IMDS can also be completely disabled on an instance if instance metadata access is not needed.
IMDSv2
IMDSv2 uses session-oriented requests.
With session-oriented requests, a session token that defines the session duration is created, which can be a minimum of one second and a maximum of six hours.
During the specified duration, the same session token can be used for subsequent requests.
After the specified duration expires, a new session token to use for future requests must be created.
IMDSv2 provides additional protection against the following vulnerabilities:
November 2023: All console Quick Start launches use IMDSv2-only
March 2024: Account-level API (ModifyInstanceMetadataDefaults) to set IMDSv2 as default for all new launches
Mid-2024: All newly released EC2 instance types use IMDSv2 only (IMDSv1 can still be re-enabled)
Amazon Linux 2023: IMDSv1 disabled by default, hop limit set to 2
Methods to enforce IMDSv2:
Set IMDSv2 as default at the account level using ModifyInstanceMetadataDefaults API
Use Declarative Policies in AWS Organizations to enforce across multiple accounts and Regions simultaneously
Configure the instance at launch time
Configure the AMI to require IMDSv2
Use IAM policies to require IMDSv2
Use the MetadataNoToken CloudWatch metric to identify IMDSv1 usage before enforcing IMDSv2
Use the IMDS Packet Analyzer tool to pinpoint exactly which software needs updating for IMDSv2 compatibility
IMDS IPv6 Support
On Nitro-based instances, IMDS is also accessible via IPv6 at fd00:ec2::254
The IPv6 endpoint can be explicitly enabled on instances
Useful for dual-stack or IPv6-only environments
Instance Tags in Metadata
Instance tags can be accessed from the instance metadata (available since January 2022)
By default, access to instance tags in metadata is disabled and must be explicitly enabled
Can be enabled at launch or after launch on a running or stopped instance
Tags can be accessed from http://169.254.169.254/latest/meta-data/tags/instance
Useful for self-configuration without needing IAM permissions to call the EC2 API
IMDS Security Considerations
IMDS runs on a loopback network interface and network calls never leave the EC2 instance
IMDSv2 protects against SSRF attacks by requiring a PUT request (which most SSRF exploits cannot make)
The hop limit of 1 in IMDSv2 prevents token retrieval from outside the instance
AWS issued a security bulletin (AWS-2025-021) regarding potential IMDS impersonation scenarios, reinforcing the importance of using IMDSv2
Ensure all SDKs, CLIs, and tools support IMDSv2 before disabling IMDSv1
User Data
User data can be used for bootstrapping (launching commands when the machine starts) EC2 instance and helps answer the What should I do?
is supplied when launching a EC2 instance and executed at boot time
can be in the form of parameters or user defined script executed when the instance is launched for e.g. perform software patch updates, load and update the application from an S3 bucket etc
can be used to build more generic AMIs, which can then be configured at launch time dynamically
can be retrieved from http://169.254.169.254/latest/user-data
By default, user data scripts and cloud-init directives run only during the first boot cycle when an EC2 instance is launched.
If you stop an instance, modify the user data, and start the instance, the new user data is not executed automatically.
is limited to 16 KB. This limit applies to the data in raw form, not base64-encoded form.
must be base64-encoded before being submitted to the API. EC2 command line tools perform the base64 encoding. The data is decoded before being presented to the instance.
Cloud-Init & EC2Launch
Cloud-Init and EC2Launch agents provide the ability to parse the user-data script on the instance and run the instructions
Cloud-Init
Amazon Linux AMI supports Cloud-Init, which is an open source application built by Canonical.
is installed on Amazon Linux 2, Amazon Linux 2023, Ubuntu, and RHEL AMIs
enables using the EC2 UserData parameter to specify actions to run on the instance at boot time
User data is executed on first boot using Cloud-Init, if the user data begins with #!
EC2Launch v2 (Current – Windows Server 2022 and later)
EC2Launch v2 is the latest Windows launch agent that replaces both EC2Config and EC2Launch v1
Pre-installed on Windows Server 2022 and Windows Server 2025 AMIs
Supports all EC2Config and EC2Launch features with additional capabilities
Uses a YAML-based configuration for better control over launch tasks
User data is executed if it begins with <script> or <powershell>
Runs tasks at instance startup and supports task scheduling
Includes Sysprep support for creating custom Windows AMIs
Supports IMDSv2 natively
EC2Launch v1 (Legacy – Windows Server 2016/2019)
Replaced EC2Config on Windows Server 2016 and 2019
Version 1.3.2002730 or later required for IMDSv2 support
AWS recommends migrating to EC2Launch v2
EC2Config (Deprecated)
EC2Config was used on Windows Server 2012 and earlier
EC2Config is deprecated — the Windows Server versions it supports (2012 and earlier) are no longer supported by Microsoft
AWS strongly recommends upgrading to EC2Launch v2 on a supported OS version
Documentation is maintained for historical reference only
AWS Certification Exam Practice Questions
Questions are collected from Internet and the answers are marked as per my knowledge and understanding (which might differ with yours).
AWS services are updated everyday and both the answers and questions might be outdated soon, so research accordingly.
AWS exam questions are not updated to keep up the pace with AWS updates, so even if the underlying feature has changed the question might not be updated
Open to further feedback, discussion and correction.
How can software determine the public and private IP addresses of the Amazon EC2 instance that it is running on?
Query the local instance metadata
Query the appropriate Amazon CloudWatch metric.
Query the local instance userdata.
Use ipconfig or ifconfig command.
The base URI for all requests for instance metadata is ___________
http://254.169.169.254/latest/
http://169.169.254.254/latest/
http://127.0.0.1/latest/
http://169.254.169.254/latest/
Which Amazon Elastic Compute Cloud feature can you query from within the instance to access instance properties?
Instance user data
Resource tags
Instance metadata
Amazon Machine Image
You need to pass a custom script to new Amazon Linux instances created in your Auto Scaling group. Which feature allows you to accomplish this?
User data
EC2Config service
IAM roles
AWS Config
By default, when an EBS volume is attached to a Windows instance, it may show up as any drive letter on the instance. You can change the settings of the _____ Service to set the drive letters of the EBS volumes per your specifications.
EBSConfig Service
AMIConfig Service
EC2Launch v2 Service(Note: Previously EC2Config Service. EC2Launch v2 is the current service for Windows Server 2022+)
Ec2-AMIConfig Service
How can software determine the public and private IP addresses of the Amazon EC2 instance that it is running on?
Query the appropriate Amazon CloudWatch metric.
Use ipconfig or ifconfig command.
Query the local instance userdata.
Query the local instance metadata.
A security team wants to ensure that all EC2 instances in their account use only IMDSv2 and IMDSv1 is disabled. Which of the following approaches can achieve this? (Select TWO)
Use the ModifyInstanceMetadataDefaults API to set IMDSv2 as required at the account level
Disable the instance metadata service entirely
Use Declarative Policies in AWS Organizations to enforce IMDSv2 across the organization
Set the hop limit to 0
Create a security group rule to block IMDSv1 requests
An application running in a Docker container on an EC2 instance is unable to retrieve the IMDSv2 session token. What is the most likely cause?
The security group is blocking metadata access
The HTTP PUT response hop limit is set to 1, which does not allow the token to reach the container
IMDSv2 does not support containerized workloads
The container is not using the correct IP address
Which of the following is the IPv6 address for accessing the Instance Metadata Service on Nitro-based instances?
fe80::254
fc00:ec2::254
fd00:ec2::254
::1/metadata
A company wants to allow EC2 instances to access their own tags without making API calls. What should they do?
Tags are automatically available in instance metadata
Enable the “Allow access to tags in instance metadata” option for the instance
Attach an IAM role with ec2:DescribeTags permission
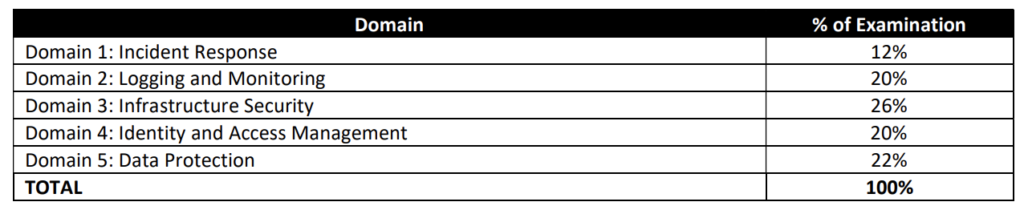
I recently re-certified AWS Certified Security – Specialty (SCS-C01) after first clearing the same in 2019 and the format, and domains are pretty much the same however has been enhanced to cover all the latest services.
The AWS Certified Security – Specialty (SCS-C01) exam focuses on the AWS Security and Compliance concepts. It basically validates
An understanding of specialized data classifications and AWS data protection mechanisms.
An understanding of data-encryption methods and AWS mechanisms to implement them.
An understanding of secure Internet protocols and AWS mechanisms to implement them.
A working knowledge of AWS security services and features of services to provide a secure production environment.
Competency gained from two or more years of production deployment experience using AWS security services and features.
The ability to make tradeoff decisions with regard to cost, security, and deployment complexity given a set of application requirements. An understanding of security operations and risks
Specialty exams are tough, lengthy, and tiresome. Most of the questions and answers options have a lot of prose and a lot of reading that needs to be done, so be sure you are prepared and manage your time well.
SCS-C01 exam has 65 questions to be solved in 170 minutes which gives you roughly 2 1/2 minutes to attempt each question.
SCS-C01 exam includes two types of questions, multiple-choice and multiple-response.
SCS-C01 has a scaled score between 100 and 1,000. The scaled score needed to pass the exam is 750.
Associate exams currently cost $ 300 + tax.
You can get an additional 30 minutes if English is your second language by requesting Exam Accommodations. It might not be needed for Associate exams but is helpful for Professional and Specialty ones.
As always, mark the questions for review and move on and come back to them after you are done with all.
As always, having a rough architecture or mental picture of the setup helps focus on the areas that you need to improve. Trust me, you will be able to eliminate 2 answers for sure and then need to focus on only the other two. Read the other 2 answers to check the difference area and that would help you reach the right answer or at least have a 50% chance of getting it right.
AWS exams can be taken either remotely or online, I prefer to take them online as it provides a lot of flexibility. Just make sure you have a proper place to take the exam with no disturbance and nothing around you.
Also, if you are taking the AWS Online exam for the first time try to join at least 30 minutes before the actual time as I have had issues with both PSI and Pearson with long wait times.
AWS Certified Security – Specialty (SCS-C01) exam focuses a lot on Security & Compliance concepts involving Data Encryption at rest or in transit, Data protection, Auditing, Compliance and regulatory requirements, and automated remediation.
IAM Roles to grant the service, users temporary access to AWS services.
IAM Role can be used to give cross-account access and usually involves creating a role within the trusting account with a trust and permission policy and granting the user in the trusted account permissions to assume the trusting account role.
Identity Providers & Federation to grant external user identity (SAML or Open ID compatible IdPs) permissions to AWS resources without having to be created within the AWS account.
IAM Policies help define who has access & what actions can they perform.
Key policies are the primary way to control access to KMS keys. Unless the key policy explicitly allows it, you cannot use IAM policies to allow access to a KMS key.
are regional, however, supports multi-region keys, which are KMS keys in different AWS Regions that can be used interchangeably – as though you had the same key in multiple Regions.
is a threat detection service that continuously monitors the AWS accounts and workloads for malicious activity and delivers detailed security findings for visibility and remediation.
supports CloudTrail S3 data events and management event logs, DNS logs, EKS audit logs, and VPC flow logs.
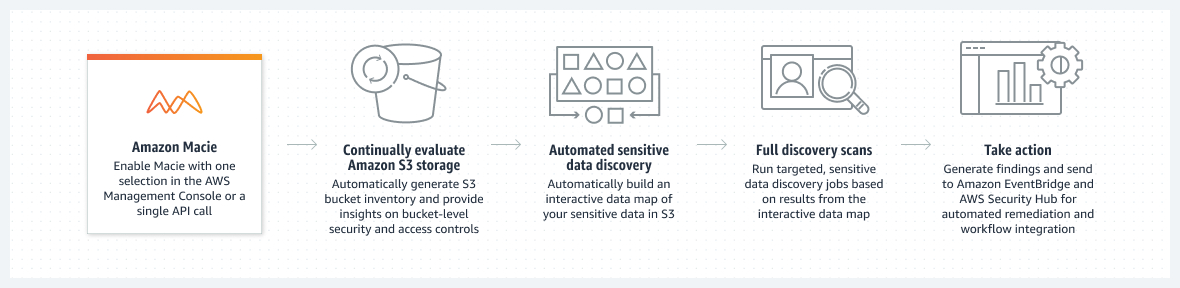
is a security service that uses machine learning to automatically discover, classify, and protect sensitive data in S3.
AWS Artifact is a central resource for compliance-related information that provides on-demand access to AWS’ security and compliance reports and select online agreements
protects from common attack techniques like SQL injection and XSS, Conditions based include IP addresses, HTTP headers, HTTP body, and URI strings.
integrates with CloudFront, ALB, and API Gateway.
supports Web ACLs and can block traffic based on IPs, Rate limits, and specific countries as well
allows IP match set rule to allow/deny specific IP addresses and rate-based rule to limit the number of requests.
logs can be sent to the CloudWatch Logs log group, an S3 bucket, or Kinesis Data Firehose.
AWS Security Hub is a cloud security posture management service that performs security best practice checks, aggregates alerts, and enables automated remediation.
AWS Network Firewall is a stateful, fully managed, network firewall and intrusion detection and prevention service (IDS/IPS) for VPCs.
AWS Resource Access Manager helps you securely share your resources across AWS accounts, within your organization or organizational units (OUs), and with IAM roles and users for supported resource types.
AWS Signer is a fully managed code-signing service to ensure the trust and integrity of your code.
AWS Audit Manager to map your compliance requirements to AWS usage data with prebuilt and custom frameworks and automated evidence collection.
Firewall Manager helps centrally configure and manage firewall rules across the accounts and applications in AWS Organizations which includes a variety of protections, including WAF, Shield Advanced, VPC security groups, Network Firewall, and Route 53 Resolver DNS Firewall.
helps improve the cache hit ratio and reduce the load on the origin.
requests from other regional caches would hit the Origin shield rather than the Origin.
should be placed at the regional cache and not in the edge cache
should be deployed to the region closer to the origin server
CloudFront provides Encryption at Rest
uses SSDs which are encrypted for edge location points of presence (POPs), and encrypted EBS volumes for Regional Edge Caches (RECs).
Function code and configuration are always stored in an encrypted format on the encrypted SSDs on the edge location POPs, and in other storage locations used by CloudFront.
Restricting access to content
Configure HTTPS connections
Use signed URLs or cookies to restrict access for selected users
Restrict access to content in S3 buckets using origin access identity – OAI, to prevent users from using the direct URL of the file.
Set up field-level encryption for specific content fields
Use AWS WAF web ACLs to create a web access control list (web ACL) to restrict access to your content.
Use Geo-restriction, also known as geoblocking, to prevent users in specific geographic locations from accessing content served through a CloudFront distribution.
is a highly available and scalable DNS web service.
Resolver Query logging
logs the queries that originate in specified VPCs, on-premises resources that use inbound resolver or ones using outbound resolver as well as the responses to those DNS queries.
can be logged to CloudWatch logs, S3, and Kinesis Data Firehose
Route 53 DNSSEC secures DNS traffic, and helps protect a domain from DNS spoofing man-in-the-middle attacks.
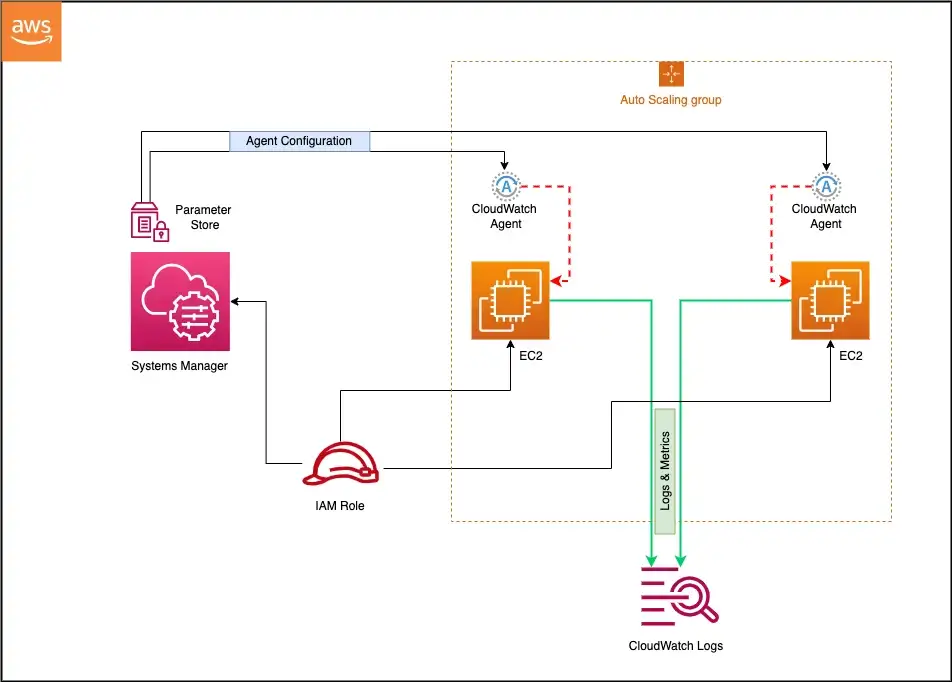
AWS Config rules can be used to alert for any changes and Config can be used to check the history of changes. AWS Config can also help check approved AMIs compliance
allows you to remediate noncompliant resources using AWS Systems Manager Automation documents.
Parameter Store provides secure, scalable, centralized, hierarchical storage for configuration data and secret management. Does not support secrets rotation. Use Secrets Manager instead
Systems Manager Patch Manager helps select and deploy the operating system and software patches automatically across large groups of EC2 or on-premises instances
Systems Manager Run Command provides safe, secure remote management of your instances at scale without logging into the servers, replacing the need for bastion hosts, SSH, or remote PowerShell
Session Manager provides secure and auditable instance management without the need to open inbound ports, maintain bastion hosts, or manage SSH keys.
Deletion Policy to prevent, retain, or backup RDS, EBS Volumes
Stack policy can prevent stack resources from being unintentionally updated or deleted during a stack update. Stack Policy only applies for Stack updates and not stack deletion.
S3 Object Lock helps to store objects using a WORM model and can help prevent objects from being deleted or overwritten for a fixed amount of time or indefinitely.
S3 Block Public Access provides controls across an entire AWS Account or at the individual S3 bucket level to ensure that objects never have public access, now and in the future.
S3 Access Points simplify data access for any AWS service or customer application that stores data in S3.
S3 Versioning with MFA Delete can be enabled on a bucket to ensure that data in the bucket cannot be accidentally overwritten or deleted.
S3 Access Analyzer monitors the access policies, ensuring that the policies provide only the intended access to your S3 resources.
is a web service that makes it easier to set up, operate, and scale a relational database in the cloud.
supports the same encryption at rest methods as EBS
does not support enabling encryption after creation. Need to create a snapshot, copy the snapshot to an encrypted snapshot and restore it as an encrypted DB.
Compute
EC2 access using IAM Role, Lambda using the Execution role & ECS using the Task role.
EC2 Network covers a lot of features for low latency access, High Performance Computing, Enhanced Networking, ENA Express, Elastic Fabric Adapter, etc.
📌 Key Updates (2024-2026):
EC2-Classic fully retired (August 2023) – All instances now run in VPC only
Public IPv4 address charges – $0.005/IP/hour for ALL public IPv4 addresses (February 2024)
ENA Express – Up to 25 Gbps single-flow bandwidth using SRD protocol, now supports cross-AZ traffic (2026)
Network bandwidth – Up to 600 Gbps with C8gn/R8gn instances (6th gen Nitro Cards)
Jumbo frames – Cross-region VPC peering now supports up to 8500 bytes MTU (March 2025)
Instance Bandwidth Weighting – Adjust VPC/EBS bandwidth split by up to 25% (December 2024)
EC2-Classic was fully retired in August 2023. All instances must be launched in a VPC.
Launching an EC2 instance within a VPC provides the following benefits
Assign static private IP addresses to instances that persist across starts and stops
Assign multiple IP addresses to the instances
Define network interfaces, and attach one or more network interfaces to the instances
Change security group membership for the instances while they’re running
Control the outbound traffic from the instances (egress filtering) in addition to controlling the inbound traffic to them (ingress filtering)
Add an additional layer of access control to the instances in the form of network access control lists (ACL)
Run the instances on single-tenant dedicated hardware
Launch instances in IPv6-only, dual-stack, or IPv4-only subnets
EC2 Instance IP Addressing
Private IP address & Internal DNS Hostnames
Private IP address is the IP address that’s not reachable over the internet and can be resolved only within the network
When an instance is launched, the default network interface eth0 is assigned a private IP address and an internal DNS hostname, which resolves to the private IP address and can be used for communication between the instances in the same network only
Private IP address and DNS hostname cannot be resolved outside the network that the instance is in.
Private IP address behaviour
remains associated with the instance when it is stopped or rebooted
is disassociated only when the instance is terminated
An instance when launched can be assigned a private IP address or EC2 will automatically assign an IP address to the instance within the address range of the subnet
Additional private IP addresses, known as secondary private IP addresses can also be assigned. Unlike primary private IP addresses, secondary private IP addresses can be reassigned from one instance to another.
Public IP address and External DNS hostnames
A public IP address is reachable from the Internet
Each instance assigned a public IP address is also given an External DNS hostname.
External DNS hostname resolves to the public IP address outside the network and to the private IP address within the network.
Public IP address is associated with the primary Private IP address through NAT
Within a VPC, an instance may or may not be assigned a public IP address depending upon the subnet Assign Public IP attribute
Public IP address assigned to the pool is from the public IP address pool and is assigned to the instance, and not to the AWS account. It cannot be reused once disassociated and is released back to the pool
Public IP address behaviour
cannot be manually associated or disassociated with an instance
is released when an instance is stopped or terminated.
a new public IP address is assigned when a stopped instance is started
is released when an instance is assigned an Elastic IP address
is not assigned if there is more than one network interface attached to the instance
As of February 2024, all public IPv4 addresses incur a charge of $0.005 per IP per hour, whether attached to a service or not. This applies to both auto-assigned public IPs and Elastic IPs.
IPv6 Addresses
IPv6 addresses are globally unique and reachable over the Internet
An instance can be launched in an IPv6-only subnet (Nitro-based instances only), dual-stack subnet, or IPv4-only subnet
IPv6 addresses persist when an instance is stopped and started
IPv6 addresses are not charged, making them a cost-effective alternative to public IPv4
Multiple Private IP addresses
Multiple private IP addresses can be specified to the instances.
This can be useful in the following cases
Host multiple websites on a single server by using multiple SSL certificates on a single server and associating each certificate with a specific IP address.
Operate network appliances, such as firewalls or load balancers, that have multiple private IP addresses for each network interface.
Redirect internal traffic to a standby instance in case the instance fails, by reassigning the secondary private IP address to the standby instance.
Multiple IP addresses work with Network Interfaces
Secondary IP address can be assigned to any network interface, which can be attached or detached from an instance
Secondary IP address must be assigned from the CIDR block range of the subnet for the network interface
Security groups apply to network interfaces and not to IP addresses
Secondary private IP addresses that are assigned to ENIs attached to running or stopped instances.
Secondary private IP addresses that are assigned to a network interface can be reassigned to another one if you explicitly allow it.
Primary private IP addresses, secondary private IP addresses, and any associated Elastic IP addresses remain with the network interface when it is detached from an instance or attached to another instance.
Although the primary network interface cannot be moved from an instance, the secondary private IP address of the primary network interface can be reassigned to another network interface.
IP Prefix Delegation
Instead of assigning individual secondary IP addresses, you can assign IP address prefixes to network interfaces
IPv4 prefixes: /28 (16 IP addresses) can be assigned per prefix
IPv6 prefixes: /80 can be assigned per prefix
Significantly increases the number of IP addresses available per ENI
Particularly useful for container workloads (e.g., Amazon EKS with VPC CNI plugin) to increase pod density per node
Can be auto-assigned or manually specified when creating or modifying a network interface
Elastic IP Addresses
An Elastic IP address is a static IPv4 address designed for dynamic cloud computing.
An elastic IP address can help mask the failure of an instance or software by rapidly remapping the address to another instance in the account.
The elastic IP address is associated with the AWS account and it remains associated with the account until released explicitly
An elastic IP address is NOT associated with a particular instance
An instance launched in a non-default VPC is assigned only a private IP address unless a public address is specifically requested or the subnet public IP attribute is enabled
When an Elastic IP address is assigned to an instance, the public IP address is disassociated with the instance
For an instance, without a public IP address, to communicate to the internet it must be assigned an Elastic IP address
When the Elastic IP address is dissociated the public IP address is assigned back to the instance. However, if a secondary network interface is attached to the instance, the public IP address is not automatically assigned
Elastic IP Address Pricing (Updated February 2024)
All public IPv4 addresses (including EIPs) are now charged at $0.005 per IP per hour (~$3.60/month), whether in-use or idle
This replaces the previous model where only unused EIPs were charged
AWS Free Tier includes 750 hours of public IPv4 address usage per month for the first 12 months
You are NOT charged for IP addresses you own and bring to AWS using BYOIP (Bring Your Own IP)
Consider migrating to IPv6 to reduce costs
All AWS accounts are limited to 5 EIPs per Region (soft limit, can request increase)
Elastic IP supports tagging for cost allocation and organization
Elastic Network Interfaces (ENI)
Elastic Network Interfaces (ENIs) are virtual network interfaces that can be attached to instances running in a VPC
ENI consists of the following
A primary private IPv4 address
One or more secondary private IPv4 addresses
One Elastic IP address per private IPv4 address
One public IPv4 address, which can be auto-assigned to the elastic network interface for eth0 when an instance is launched
One or more IPv6 addresses
One or more security groups
A MAC address
A source/destination check flag
A description
IPv4 prefixes (/28) and IPv6 prefixes (/80) for prefix delegation
ENI can be created without being attached to an instance
ENI can be attached to an instance, detached from that instance and attached to another instance. Attributes of an ENI like elastic IP address, private IP address follow the ENI and when moved from one instance to another instance, all traffic to the ENI will be routed to the new instance.
An instance in VPC always has a default primary ENI attached (eth0) with a private IP address assigned from the VPC range and cannot be detached
Additional ENI (eth1-ethn) can be attached to the instance and the number varies depending upon the instance type
Most important difference between eth0 and eth1 is that eth0 cannot be dynamically attached or detached from a running instance.
Primary ENIs (eth0) are created automatically when an EC2 instance is launched and are also deleted automatically when the instance is terminated unless the administrator has changed a property of the ENI to keep it alive afterwards.
Multiple elastic network interfaces are useful for use cases:
Create a management network
Primary ENI eth0 handles backend with more restrictive control
Secondary ENI eth1 handles the public facing traffic
Licensing authentication
Fixed MAC address associated with a license authentication
Use network and security appliances in your VPC
configure a third-party network and security appliances (load balancers, NAT, proxy) with the secondary ENI
Create dual-homed instances with workloads/roles on distinct subnets.
Create a low-budget, high-availability solution
If one of the instances serving a particular function fails, its elastic network interface can be attached to a replacement or hot standby instance pre-configured for the same role in order to rapidly recover the service
As the interface maintains its private IP, EIP, and MAC address, network traffic will begin flowing to the standby instance as soon as it is attached to the replacement instance
ENI Best Practices
ENI can be attached to an instance when it’s running (hot attach), when it’s stopped (warm attach), or when the instance is being launched (cold attach).
Primary (eth0) interface can’t be detached
Secondary (ethN) ENI can be detached when the instance is running or stopped.
ENI in one subnet can be attached to an instance in another subnet, but the same AZ and same VPC
When launching an instance from the CLI or API, both the primary (eth0) and additional elastic network interfaces can be specified
Launching an Amazon Linux or Microsoft Windows Server instance with multiple network interfaces automatically configures interfaces, private IP addresses, and route tables on the operating system of the instance.
A warm or hot attach of an additional ENI may require bringing up the second interface manually, configure the private IP address, and modify the route table accordingly.
Instances running Amazon Linux or Microsoft Windows Server automatically recognize the warm or hot attach and configure themselves.
Attaching another ENI to an instance is not a method to increase or double the network bandwidth to or from the dual-homed instance.
ENA Queue Allocation (2025) – EC2 now supports flexible ENA queue allocation per ENI, enabling efficient load-balancing of network traffic across available queues on each network interface.
EC2 Placement groups determine how the instances are placed on the underlying hardware.
AWS provides three types of placement groups
Cluster – clusters instances into a low-latency group in a single AZ
Partition – spreads instances across logical partitions, ensuring that instances in one partition do not share underlying hardware with instances in other partitions
Spread – strictly places a small group of instances across distinct underlying hardware to reduce correlated failures
On-Demand Capacity Reservations in Cluster Placement Groups (2025)
CPG-ODCRs provide assured capacity with low latency and high throughput within a Cluster Placement Group
Supports sharing and targeting capabilities for cross-account usage
Can be scheduled up to 120 days in advance with future-dated capacity reservations
Network Maximum Transmission Unit – MTU
MTU of a network connection is the size, in bytes, of the largest permissible packet that can be transferred over the connection.
The larger the MTU of the connection the more the data can be transferred in a single packet
Largest ethernet packet size supported over most of the internet is 1500 MTU
Jumbo Frames
Jumbo frames are Ethernet frames that allow more than 1500 bytes of data by increasing the payload size per packet and thus increasing the percentage of the packet that is not packet overhead.
Fewer packets are needed to send the same amount of usable data
Jumbo frames should be used with caution for Internet-bound traffic or any traffic that leaves a VPC.
Packets are fragmented by intermediate systems, which slows down this traffic.
Maximum supported MTU for an instance depends on its instance type
All EC2 instance types support 1500 MTU, and many current instance sizes support 9001 MTU or Jumbo frames
Traffic is limited to a maximum MTU of 1500 in the following cases:
Traffic over VPN connections
Traffic over an internet gateway
Updated MTU Support (March 2025):
Cross-region VPC peering now supports jumbo frames up to 8500 bytes MTU (previously limited to 1500)
EC2 now supports full instance bandwidth for inter-region VPC peering traffic and to AWS Direct Connect
Transit Gateway supports 8500 MTU for all attachments
Intra-region VPC peering continues to support 9001 MTU (jumbo frames)
For instances that are collocated inside a placement group, jumbo frames help to achieve the maximum network throughput possible, and they are recommended in this case.
Enhanced networking results in higher bandwidth, higher packet per second (PPS) performance, lower latency, consistency, scalability, and lower jitter.
EC2 provides enhanced networking capabilities using single root I/O virtualization (SR-IOV) on supported instance types
SR-IOV is a method of device virtualization that provides higher I/O performance and lower CPU utilization
Two mechanisms for enhanced networking:
Elastic Network Adapter (ENA) – supports network speeds of up to 100 Gbps (up to 600 Gbps on network-optimized instances). All instances built on the AWS Nitro System use ENA.
Intel 82599 Virtual Function (VF) interface – uses the Intel ixgbevf driver, supports up to 10 Gbps. Only for legacy Xen-based instance types (C3, C4, R3, I2, M4, D2).
All current-generation instances support enhanced networking via ENA
Enhanced networking is available only within a VPC
ENA Express
ENA Express is an enhanced networking feature that uses the AWS Scalable Reliable Datagram (SRD) protocol to improve network performance
SRD is a high-performance network transport protocol that uses dynamic routing to increase throughput and minimize tail latency
Key Benefits:
Increases maximum single-flow bandwidth from 5 Gbps up to 25 Gbps (up to the aggregate instance limit)
Reduces tail latency by up to 93% (P99.9) during periods of high network load
Detects and avoids congested network paths through multi-pathing
Handles packet reordering and most retransmits in the network layer, freeing the application layer
How it works:
Enabled per network interface attachment via API call or AWS Console toggle
Sending instance initiates SRD communication if both sender and receiver have ENA Express enabled
Falls back to standard ENA transmission if the receiving instance does not support ENA Express
Works transparently with TCP and UDP protocols
Scope:
Originally supported traffic within the same Availability Zone only
May 2026: ENA Express now supports cross-AZ traffic within a Region, delivering up to 25 Gbps single-flow bandwidth between AZs
Supported on a wide range of instance types (120+ instance types as of 2025)
ENA Express traffic cannot be sent in a Local Zone
Best suited for workloads requiring high single-flow throughput; for workloads needing lowest latency with high PPS during non-congestion, standard enhanced networking may be preferable
Instance Bandwidth Weighting
Launched December 2024 – allows adjusting the VPC networking and EBS bandwidth allocation on EC2 instances
Customers can shift bandwidth by up to 25% between VPC and EBS in either direction
When increasing bandwidth for one service (e.g., VPC), the available bandwidth for the other (EBS) is reduced by the same absolute amount
Useful for workloads that are either network-intensive or storage-intensive but not both simultaneously
Burst bandwidth remains the same for the selected option on most instance types
Network Bandwidth Capabilities (2025-2026)
Network-optimized instances now support up to 600 Gbps network bandwidth:
C8gn – Graviton4-based, up to 600 Gbps (GA June 2025)
R8gn – Graviton4-based, up to 600 Gbps (GA September 2025)
M8gn – Graviton4-based, up to 600 Gbps (GA December 2025)
R8in/R8idn – Intel-based, up to 600 Gbps (2026)
These instances feature 6th generation AWS Nitro Cards
Previous generation network-optimized instances (C6in, R6in, R6idn) support up to 200 Gbps
Elastic Fabric Adapter – EFA
An Elastic Fabric Adapter (EFA) is a network device that can be attached to the EC2 instance to accelerate High Performance Computing (HPC) and machine learning applications.
EFA helps achieve the application performance of an on-premises HPC cluster, with the scalability, flexibility, and elasticity provided by AWS.
EFA provides lower and more consistent latency and higher throughput than the TCP transport traditionally used in cloud-based HPC systems.
EFA enhances the performance of inter-instance communication which is critical for scaling HPC and machine learning applications.
EFA is optimized to work on the existing AWS network infrastructure and it can scale depending on application requirements.
EFAs provide all of the same traditional IP networking features as ENAs, and they also support OS-bypass capabilities. OS-bypass enables HPC and machine learning applications to bypass the operating system kernel and to communicate directly with the EFA device.
EFA uses the AWS Scalable Reliable Datagram (SRD) protocol to increase network throughput utilization
EFA Updates (2024-2026):
Cross-subnet communication (July 2024) – EFA now supports traffic across subnets for both existing and new instances. Requires security group rules to allow cross-subnet traffic.
EFA-only interface (October 2024) – New interface type that decouples EFA from ENA. Allows standalone EFA devices on secondary interfaces without requiring IP addresses, solving IPv4 address exhaustion and IP routing challenges for AI/ML clusters.
New EFA observability metrics (September 2025) – Metrics for retransmitted packets/bytes, retransmit timeout events, impaired remote connections, and unresponsive remote receiver events.
NIXL support with EFA (March 2026) – Accelerates LLM inference at scale through increased KV-cache throughput, reduced inter-token latency, and optimized KV-cache memory utilization.
Kubernetes Dynamic Resource Allocation for EFA (May 2026) – Amazon EKS supports DRA for EFA, simplifying RDMA configuration for AI/ML and HPC workloads.
SageMaker HyperPod EFA-only support (June 2026) – Dedicated EFA devices without traditional ENA for IP networking in SageMaker clusters.
AWS Certification Exam Practice Questions
Questions are collected from Internet and the answers are marked as per my knowledge and understanding (which might differ with yours).
AWS services are updated everyday and both the answers and questions might be outdated soon, so research accordingly.
AWS exam questions are not updated to keep up the pace with AWS updates, so even if the underlying feature has changed the question might not be updated
Open to further feedback, discussion and correction.
A user is launching an EC2 instance in the US East region. Which of the below mentioned options is recommended by AWS with respect to the selection of the availability zone?
Always select the US-East-1-a zone for HA
Do not select the AZ; instead let AWS select the AZ
The user can never select the availability zone while launching an instance
Always select the AZ while launching an instance
You have multiple Amazon EC2 instances running in a cluster across multiple Availability Zones within the same region. What combination of the following should be used to ensure the highest network performance (packets per second), lowest latency, and lowest jitter? Choose 3 answers
Amazon EC2 placement groups (would not work for multiple AZs. Defaults to Cluster)
Amazon Linux (Can work on other flavors of Unix as well)
Amazon VPC (Enhanced networking works only in VPC)
Regarding the attaching of ENI to an instance, what does ‘warm attach’ refer to?
Attaching an ENI to an instance when it is stopped
Attaching an ENI to an instance when it is running
Attaching an ENI to an instance during the launch process
Can I detach the primary (eth0) network interface when the instance is running or stopped?
Yes, You can.
You cannot
Depends on the state of the interface at the time
By default what are ENIs that are automatically created and attached to instances using the EC2 console set to do when the attached instance terminates?
Remain as is
Terminate
Hibernate
Pause
Select the incorrect statement
In Amazon VPC, the private IP addresses only returned to Amazon EC2 when the instance is terminated
In Amazon VPC, an instance retains its private IP addresses when the instance is stopped.
In Amazon VPC, an instance does NOT retain its private IP addresses when the instance is stopped
In Amazon VPC, the private IP address is associated exclusively with the instance for its lifetime
To ensure failover capabilities, consider using a _____ for incoming traffic on a network interface”.
primary public IP
secondary private IP
secondary public IP
add on secondary IP
Which statements are true about Elastic Network Interface (ENI)? (Choose 2 answers)
You can attach an ENI in one AZ to an instance in another AZ
You can change the security group membership of an ENI
You can attach an instance to two different subnets within a VPC by using two ENIs
You can attach an ENI in one VPC to an instance in another VPC
A user is planning to host a web server as well as an app server on a single EC2 instance, which is a part of the public subnet of a VPC. How can the user setup to have two separate public IPs and separate security groups for both the application as well as the web server?
Launch a VPC instance with two network interfaces. Assign a separate security group to each and AWS will assign a separate public IP to them. (AWS cannot assign public IPs for instance with multiple ENIs)
Launch VPC with two separate subnets and make the instance a part of both the subnets.
Launch a VPC instance with two network interfaces. Assign a separate security group and elastic IP to them.
Launch a VPC with ELB such that it redirects requests to separate VPC instances of the public subnet.
An organization has created multiple components of a single application for compartmentalization. Currently all the components are hosted on a single EC2 instance. Due to security reasons the organization wants to implement two separate SSLs for the separate modules although it is already using VPC. How can the organization achieve this with a single instance?
Create a VPC instance, which will have both the ACL and the security group attached to it and have separate rules for each IP address.
Create a VPC instance, which will have multiple network interfaces with multiple elastic IP addresses.
You have to launch two instances each in a separate subnet and allow VPC peering for a single IP.
Create a VPC instance, which will have multiple subnets attached to it and each will have a separate IP address.
Your system automatically provisions EIPs to EC2 instances in a VPC on boot. The system provisions the whole VPC and stack at once. You have two of them per VPC. On your new AWS account, your attempt to create a Development environment failed, after successfully creating Staging and Production environments in the same region. What happened?
You didn’t choose the Development version of the AMI you are using.
You didn’t set the Development flag to true when deploying EC2 instances.
You hit the soft limit of 5 EIPs per region and requested a 6th. (There is a soft limit of 5 EIPs per Region for VPC on new accounts. The third environment could not allocate the 6th EIP)
You hit the soft limit of 2 VPCs per region and requested a 3rd.
A user has created a VPC with a public subnet. The user has terminated all the instances, which are part of the subnet. Which of the below mentioned statements is true with respect to this scenario?
The user cannot delete the VPC since the subnet is not deleted
All network interface attached with the instances will be deleted
When the user launches a new instance it cannot use the same subnet
The subnet to which the instances were launched with will be deleted
A company wants to reduce AWS costs after learning about the new public IPv4 address charges. Which combination of approaches would help minimize public IPv4 costs? (Choose 2 answers)
Migrate workloads to IPv6-only subnets where possible (IPv6 addresses are free and eliminate the need for public IPv4)
Use more Elastic IP addresses instead of auto-assigned public IPs (Both EIPs and auto-assigned public IPs are now charged equally at $0.005/IP/hour)
Use NAT Gateway with private subnets for outbound-only internet access (Reduces number of public IPs needed; instances use private IPs)
Switch from VPC to EC2-Classic networking (EC2-Classic was fully retired in August 2023)
Which of the following is a feature of ENA Express? (Choose 2 answers)
Increases maximum single-flow bandwidth from 5 Gbps to 25 Gbps
Requires application code changes to use SRD protocol
Reduces tail latency (P99.9) for network traffic between EC2 instances
Works only with EFA-enabled instances
A machine learning team needs to scale their training cluster to thousands of instances but is running out of private IPv4 addresses. Which EFA feature should they use?
EFA cross-subnet communication
EFA-only network interfaces (EFA-only interfaces decouple EFA from ENA, allowing standalone EFA devices without requiring IP addresses)
ENA Express with SRD protocol
IP prefix delegation on ENIs
An application requires high single-flow network throughput between EC2 instances across Availability Zones. Which feature should be enabled?
Enhanced networking with Intel 82599 VF
Elastic Fabric Adapter (EFA)
ENA Express (ENA Express supports cross-AZ traffic as of May 2026, delivering up to 25 Gbps single-flow bandwidth)
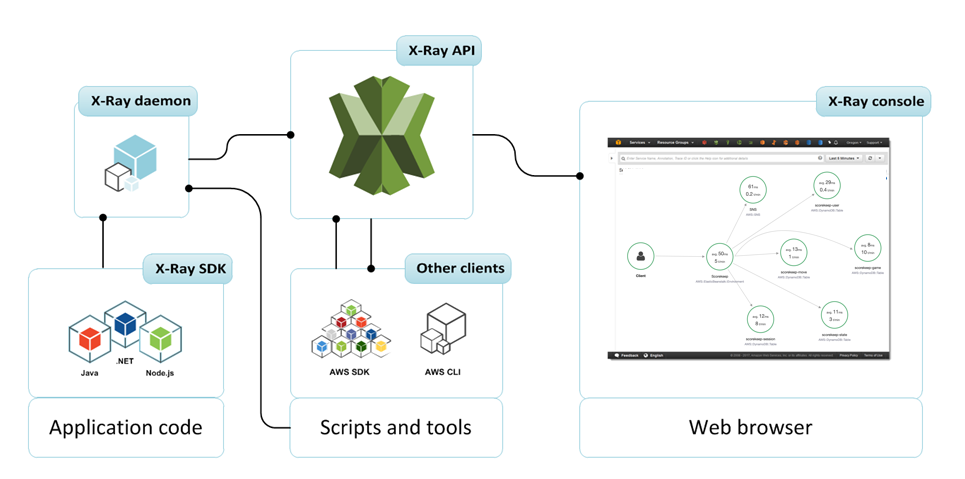
AWS X-Ray helps developers analyze and debug production, distributed applications for e.g. built using a microservices lambda architecture
provides an end-to-end view of requests as they travel through the application, and shows a map of the application’s underlying components.
helps to understand how the application and its underlying services are performing to identify and troubleshoot the root cause of performance issues and errors.
can help analyze applications in development and in production, from simple three-tier applications to complex microservices applications consisting of thousands of services.
can be used with distributed applications of any size to trace and debug both synchronous requests and asynchronous events.
can be used to track requests flowing through applications or services across multiple regions. Data is stored locally in the processed region and customers can build a solution over it to combine the data.
makes the Trace data available for retrieval and filtering within 30 seconds of it being received by the service.
stores trace data for the last 30 days.
encrypts traces and related data at rest and supports encryption in transit.
X-Ray SDK automatically captures metadata for API calls made to AWS services using the AWS SDK
X-Ray SDK provides add-ons for MySQL and PostgreSQL drivers.
For Elastic Beanstalk, include the language-specific libraries in the application code.
Applications running on other AWS services, such as EC2 or ECS, install the X-Ray agent and instrument the application code
X-Ray Core Concepts
Segment
A Segment encapsulates all the data points for a single component of the distributed application for e.g. authorization component.
A segment provides the resource’s name, details about the request, and details about the work done.
Segments include system-defined and user-defined data in the form of annotations and are composed of one or more sub-segments that represent remote calls made from the service. for e.g. database call and its result within the overall request/response
Subsegments
A segment can break down the data about the work done into subsegments.
Subsegments provide more granular timing information and details about downstream calls that the application made to fulfill the original request.
A subsegment can contain additional details about a call to an AWS service, an external HTTP API, or an SQL database.
Arbitrary subsegments can be defined to instrument specific functions or lines of code in the application.
Trace
Trace collects all the segments generated by a single request.
Trace is a set of data points that share the same trace ID.
Trace helps track the request, which is assigned a unique trace id, while it navigates through services
Piece of information relayed by each service in the application to X-Ray is a segment, and a trace is a collection of segments.
Filter Expressions
Filter expressions can be used to find traces related to specific paths or users.
Annotations and Metadata
Annotations are simple key-value pairs that are indexed for use with filter expressions.
Metadata are key-value pairs with values of any type, including objects and lists, but that is not indexed.
An Annotation is system-defined or user-defined data
System-defined annotations include data added to the segment by AWS services
User-defined annotations are metadata added to a segment by a developer
Annotations and metadata are aggregated at the trace level and can be added to any segment or subsegment.
Annotation and metadata are associated with a segment and a segment can contain multiple annotations.
Errors, Faults, and Exceptions
X-Ray errors are system annotations associated with a segment for a call that results in an error response.
Error includes the error message, stack trace, and any additional information for e.g, version to associate the error with a source file.
Error – Client errors (400 series errors)
Fault – Server faults (500 series errors)
Throttle – Throttling errors (429 Too Many Requests)
Sampling
X-Ray collects data for a significant number of requests, instead of each request sent to an application, for performant and cost-effectiveness
X-Ray should not be used as an audit or compliance tool because it does not guarantee data completeness.
By default, the X-Ray SDK records the first request each second, and five percent of any additional requests.
X-Ray Daemon
X-Ray daemon is a software application that listens for traffic on UDP port 2000, gathers raw segment data, and relays it to the AWS X-Ray API.
Daemon works in conjunction with the AWS X-Ray SDKs and must be running so that data sent by the SDKs can reach the X-Ray service.
X-Ray API
X-Ray API provides access to all X-Ray functionality through the AWS SDK, AWS Command Line Interface, or directly over HTTPS.
X-Ray with VPC Endpoints
X-Ray can be configured to use an Interface VPC endpoint, that enables you to privately access X-Ray APIs through private IP addresses.
AWS PrivateLink restricts all network traffic between the VPC and ECR to the Amazon network. You don’t need an internet gateway, a NAT device, or a virtual private gateway.
AWS Certification Exam Practice Questions
Questions are collected from Internet and the answers are marked as per my knowledge and understanding (which might differ with yours).
AWS services are updated everyday and both the answers and questions might be outdated soon, so research accordingly.
AWS exam questions are not updated to keep up the pace with AWS updates, so even if the underlying feature has changed the question might not be updated
Open to further feedback, discussion and correction.
A company is facing performance issues with their microservices architecture deployed on AWS. Which service can help them debug and analyze the issue? [CCP]
S3 Subresources provides support to store, and manage the bucket configuration information.
S3 subresources only exist in the context of a specific bucket or object
S3 subresources are associated with buckets and objects.
S3 Subresources are subordinates to objects; i.e. they do not exist on their own, they are always associated with some other entity, such as an object or a bucket.
S3 supports various options to configure a bucket for e.g., the bucket can be configured for website hosting, configuration added to manage the lifecycle of objects in the bucket, and to log all access to the bucket.
S3 can be used for Static Website hosting with Client-side scripts.
S3 does not support server-side scripting.
S3, in conjunction with Route 53, supports hosting a website at the root domain which can point to the S3 website endpoint
S3 website endpoints do not support HTTPS or access points
For S3 website hosting the content should be made publicly readable which can be provided using a bucket policy or an ACL on an object.
Users can configure the index, and error document as well as configure the conditional routing of an object name
Bucket policy applies only to objects owned by the bucket owner. If the bucket contains objects not owned by the bucket owner, then public READ permission on those objects should be granted using the object ACL.
Requester Pays buckets or DevPay buckets do not allow access through the website endpoint. Any request to such a bucket will receive a 403 -Access Denied response
All browsers implement the Same-Origin policy, for security reasons, where the web page from a domain can only request resources from the same domain.
CORS allows client web applications loaded in one domain access to the restricted resources to be requested from another domain.
With CORS support, S3 allows cross-origin access to S3 resources
CORS configuration rules identify the origins allowed to access the bucket, the operations (HTTP methods) that would be supported for each origin, and other operation-specific information.
S3 Access Logs
S3 Access Logs enable tracking access requests to an S3 bucket.
S3 Access logs are disabled by default.
Each access log record provides details about a single access request, such as the requester, bucket name, request time, request action, response status, and error code, etc.
Access log information can be useful in security and access audits and also help learn about the customer base and understand the S3 bill.
S3 periodically collects access log records, consolidates the records in log files, and then uploads log files to a target bucket as log objects.
Logging can be enabled on multiple source buckets with the same target bucket which will have access logs for all those source buckets, but each log object will report access log records for a specific source bucket.
Source and target buckets should be in the same region.
Source and target buckets should be different to avoid an infinite loop of logs issue.
Target bucket can be encrypted using SSS-S3 default encryption. However, Default encryption with AWS KMS keys (SSE-KMS) is not supported.
S3 uses a special log delivery account to write server access logs.
AWS recommends updating the bucket policy on the target bucket to grant access to the logging service principal (logging.s3.amazonaws.com) for access log delivery.
Access for access log delivery can also be granted to the S3 log delivery group through the bucket ACL. Granting access to the S3 log delivery group using your bucket ACL is not recommended.
Access log records are delivered on a best-effort basis. The completeness and timeliness of server logging is not guaranteed i.e. log record for a particular request might be delivered long after the request was actually processed, or it might not be delivered at all.
S3 Access Logs can be analyzed using data analysis tools or Athena.
Tagging
S3 provides the tagging subresource to store and manage tags on a bucket
Cost allocation tags can be added to the bucket to categorize and track AWS costs.
AWS can generate a cost allocation report with usage and costs aggregated by the tags applied to the buckets.
Location
AWS region needs to be specified during bucket creation and it cannot be changed.
S3 stores this information in the location subresource and provides an API for retrieving this information
Event Notifications
S3 notification feature enables notifications to be triggered when certain events happen in the bucket.
Notifications are enabled at the Bucket level
Notifications can be configured to be filtered by the prefix and suffix of the key name of objects. However, filtering rules cannot be defined with overlapping prefixes, overlapping suffixes, or prefix and suffix overlapping
S3 can publish the following events
New Object created events
Can be enabled for PUT, POST, or COPY operations
You will not receive event notifications from failed operations
Object Removal events
Can public delete events for object deletion, version object deletion or insertion of delete marker
You will not receive event notifications from automatic deletes from lifecycle policies or from failed operations.
Restore object events
restoration of objects archived to the S3 Glacier storage classes
Reduced Redundancy Storage (RRS) object lost events
Can be used to reproduce/recreate the Object
Replication events
for replication configurations that have S3 replication metrics or S3 Replication Time Control (S3 RTC) enabled
S3 can publish events to the following destination
For S3 to be able to publish events to the destination, the S3 principal should be granted the necessary permissions
S3 event notifications are designed to be delivered at least once. Typically, event notifications are delivered in seconds but can sometimes take a minute or longer.
S3 Replication enables automatic, asynchronous copying of objects across S3 buckets in the same or different AWS regions.
S3 Cross-Region Replication – CRR is used to copy objects across S3 buckets in different AWS Regions.
S3 Same-Region Replication – SRR is used to copy objects across S3 buckets in the same AWS Regions.
S3 Replication helps to
Replicate objects while retaining metadata
Replicate objects into different storage classes
Maintain object copies under different ownership
Keep objects stored over multiple AWS Regions
Replicate objects within 15 minutes
S3 can replicate all or a subset of objects with specific key name prefixes
S3 encrypts all data in transit across AWS regions using SSL
Object replicas in the destination bucket are exact replicas of the objects in the source bucket with the same key names and the same metadata.
Objects may be replicated to a single destination bucket or multiple destination buckets.
Cross-Region Replication can be useful for the following scenarios:-
Compliance requirement to have data backed up across regions
Minimize latency to allow users across geography to access objects
Operational reasons compute clusters in two different regions that analyze the same set of objects
Same-Region Replication can be useful for the following scenarios:-
Aggregate logs into a single bucket
Configure live replication between production and test accounts
Abide by data sovereignty laws to store multiple copies
Replication Requirements
source and destination buckets must be versioning-enabled
for CRR, the source and destination buckets must be in different AWS regions.
S3 must have permission to replicate objects from that source bucket to the destination bucket on your behalf.
If the source bucket owner also owns the object, the bucket owner has full permission to replicate the object. If not, the source bucket owner must have permission for the S3 actions s3:GetObjectVersionand s3:GetObjectVersionACLto read the object and object ACL
Setting up cross-region replication in a cross-account scenario (where the source and destination buckets are owned by different AWS accounts), the source bucket owner must have permission to replicate objects in the destination bucket.
if the source bucket has S3 Object Lock enabled, the destination buckets must also have S3 Object Lock enabled.
destination buckets cannot be configured as Requester Pays buckets
Replicated & Not Replicated
Only new objects created after you add a replication configuration are replicated. S3 does NOT retroactively replicate objects that existed before you added replication configuration.
Objects encrypted using customer provided keys (SSE-C), objects encrypted at rest under an S3 managed key (SSE-S3) or a KMS key stored in AWS Key Management Service (SSE-KMS).
S3 replicates only objects in the source bucket for which the bucket owner has permission to read objects and read ACLs
Any object ACL updates are replicated, although there can be some delay before S3 can bring the two in sync. This applies only to objects created after you add a replication configuration to the bucket.
S3 does NOT replicate objects in the source bucket for which the bucket owner does not have permission.
Updates to bucket-level S3 subresources are NOT replicated, allowing different bucket configurations on the source and destination buckets
Only customer actions are replicated & actions performed by lifecycle configuration are NOT replicated
Replication chaining is NOT allowed, Objects in the source bucket that are replicas, created by another replication, are NOT replicated.
S3 does NOT replicate the delete marker by default. However, you can add delete marker replication to non-tag-based rules to override it.
S3 does NOT replicate deletion by object version ID. This protects data from malicious deletions.
S3 Inventory
S3 Inventory helps manage the storage and can be used to audit and report on the replication and encryption status of the objects for business, compliance, and regulatory needs.
S3 inventory provides a scheduled alternative to the S3 synchronous List API operation.
S3 inventory provides CSV, ORC, or Apache Parquet output files that list the objects and their corresponding metadata on a daily or weekly basis for an S3 bucket or a shared prefix.
Requester Pays
By default, buckets are owned by the AWS account that created it (the bucket owner) and the AWS account pays for storage costs, downloads, and data transfer charges associated with the bucket.
Using Requester Pays subresource:-
Bucket owner specifies that the requester requesting the download will be charged for the download
However, the bucket owner still pays the storage costs
Enabling Requester Pays on a bucket
disables anonymous access to that bucket
does not support BitTorrent
does not support SOAP requests
cannot be enabled for end-user logging bucket
Torrent
Default distribution mechanism for S3 data is via client/server download
Bucket owner bears the cost of Storage as well as the request and transfer charges which can increase linearly for a popular object
S3 also supports the BitTorrent protocol
BitTorrent is an open-source Internet distribution protocol
BitTorrent addresses this problem by recruiting the very clients that are downloading the object as distributors themselves
S3 bandwidth rates are inexpensive, but BitTorrent allows developers to further save on bandwidth costs for a popular piece of data by letting users download from Amazon and other users simultaneously
Benefit for a publisher is that for large, popular files the amount of data actually supplied by S3 can be substantially lower than what it would have been serving the same clients via client/server download
Any object in S3 that is publicly available and can be read anonymously can be downloaded via BitTorrent
Torrent file can be retrieved for any publicly available object by simply adding a “?torrent” query string parameter at the end of the REST GET request for the object
Generating the .torrent for an object takes time proportional to the size of that object, so its recommended to make a first torrent request yourself to generate the file so that subsequent requests are faster
Torrent is enabled only for objects that are less than 5 GB in size.
Torrent subresource can only be retrieved, and cannot be created, updated, or deleted
Questions are collected from Internet and the answers are marked as per my knowledge and understanding (which might differ with yours).
AWS services are updated everyday and both the answers and questions might be outdated soon, so research accordingly.
AWS exam questions are not updated to keep up the pace with AWS updates, so even if the underlying feature has changed the question might not be updated
Open to further feedback, discussion and correction.
An organization’s security policy requires multiple copies of all critical data to be replicated across at least a primary and backup data center. The organization has decided to store some critical data on Amazon S3. Which option should you implement to ensure this requirement is met?
Use the S3 copy API to replicate data between two S3 buckets in different regions
You do not need to implement anything since S3 data is automatically replicated between regions
Use the S3 copy API to replicate data between two S3 buckets in different facilities within an AWS Region
You do not need to implement anything since S3 data is automatically replicated between multiple facilities within an AWS Region
A customer wants to track access to their Amazon Simple Storage Service (S3) buckets and also use this information for their internal security and access audits. Which of the following will meet the Customer requirement?
Enable AWS CloudTrail to audit all Amazon S3 bucket access.
Enable server access logging for all required Amazon S3 buckets
Enable the Requester Pays option to track access via AWS Billing
Enable Amazon S3 event notifications for Put and Post.
A user is enabling a static website hosting on an S3 bucket. Which of the below mentioned parameters cannot be configured by the user?
Error document
Conditional error on object name
Index document
Conditional redirection on object name
Company ABCD is running their corporate website on Amazon S3 accessed from http//www.companyabcd.com. Their marketing team has published new web fonts to a separate S3 bucket accessed by the S3 endpoint: https://s3-us-west1.amazonaws.com/abcdfonts. While testing the new web fonts, Company ABCD recognized the web fonts are being blocked by the browser. What should Company ABCD do to prevent the web fonts from being blocked by the browser?
Enable versioning on the abcdfonts bucket for each web font
Create a policy on the abcdfonts bucket to enable access to everyone
Add the Content-MD5 header to the request for webfonts in the abcdfonts bucket from the website
Configure the abcdfonts bucket to allow cross-origin requests by creating a CORS configuration
Company ABCD is currently hosting their corporate site in an Amazon S3 bucket with Static Website Hosting enabled. Currently, when visitors go to http://www.companyabcd.com the index.html page is returned. Company C now would like a new page welcome.html to be returned when a visitor enters http://www.companyabcd.com in the browser. Which of the following steps will allow Company ABCD to meet this requirement? Choose 2 answers.
Upload an html page named welcome.html to their S3 bucket
An Amazon Machine Image – AMI provides the information required to launch an instance, which is a virtual server in the cloud.
An AMI is basically a template and can be used to launch as many instances as needed
Within a VPC, instances can be launched from as many different AMIs
An AMI includes the following:
One or more EBS snapshots, or, for instance-store-backed AMIs, a template for the root volume of the instance for e.g, an operating system, an application server, and applications
Launch permissions that control which AWS accounts can use the AMI to launch instances for e.g. AWS account ids whom the AMI is shared
A block device mapping that specifies the volumes to attach to the instance when it’s launched
Amazon Machine Images can be either
AWS managed, provided, and published AMIs
Third-party or Community provided public custom AMIs
Private AMIs created by other AWS accounts and shared with you
Private and Custom AMIs created by you
AMI Types
Region & Availability Zone
are regional but can be copied over to other regions
Operating system
are available in a variety of OS flavors for e.g. Linux, windows, etc.
Architecture (32-bit, 64-bit x86_64, or 64-bit ARM arm64)
ARM-based (arm64) AMIs are used with AWS Graviton processors (Graviton2, Graviton3, Graviton4) for better price-performance
Launch Permissions
Launch permissions define who has access to the AMI
Public – Accessible to all AWS accounts
Explicit – Shared with specific AWS accounts, Organizations, or Organizational Units (OUs)
Private/Implicit – Owned and available for AMI creator account only
Boot Mode
AMIs can be configured with a boot mode parameter: legacy-bios, uefi, or uefi-preferred
UEFI boot mode is required for Graviton instances and supports features like UEFI Secure Boot and NitroTPM
If no boot mode parameter is set, Graviton instances default to uefi, while Intel/AMD default to legacy-bios
Root device storage
can have EBS or Instance store as the root device storage
EBS volumes are independent of the EC2 instance lifecycle and can persist independently
EBS backed instances can be stopped without losing the volumes
EBS instance can also be persisted without losing the volumes on instance termination if the Delete On Termination flag is disabled
EBS backed instances boot up much faster than the Instance store backed instances as only the parts required to boot the instance needs to be retrieved from the snapshot before the instance is made available
AMI creation is much easier for AMIs backed by EBS. The CreateImage API action creates the EBS-backed AMI and registers it
EBS-backed AMIs are the recommended and standard approach for all new workloads
Instance store-backed AMIs are considered end of life and are not recommended for new usage.
They are only supported on older instance types: C1, C3, D2, I2, M1, M2, M3, R3, and X1.
Instance store is ephemeral storage and is dependent on the lifecycle of the Instance
Instance store is deleted if the instance is terminated or if the EBS backed instance, with attached instance store volumes, is stopped
Instance store volumes cannot be stopped
Instance store volumes have their AMI in S3 and have higher boot times compared to EBS backed instances, as all the parts have to be retrieved from S3 before the instance is made available
To create Linux AMIs backed by the instance store, you must create an AMI from your instance on the instance itself using the Amazon EC2 AMI tools.
Linux Amazon Machine Images use one of two types of virtualization: paravirtual (PV) or hardware virtual machine (HVM).
Main difference between PV and HVM AMIs is the way in which they boot and whether they can take advantage of special hardware extensions (CPU, network, and storage) for better performance.
AWS recommends the use of current generation instance types and HVM AMIs for all workloads. PV AMIs are legacy and only supported on older instance types.
HVM AMIs
HVM AMIs are presented with a fully virtualized set of hardware and boot by executing the master boot record of the root block device of the image.
HVM virtualization type provides the ability to run an operating system directly on top of a virtual machine without any modification as if it were run on bare-metal hardware.
EC2 host system emulates some or all of the underlying hardware that is presented to the guest.
HVM guests, unlike PV guests, can take advantage of hardware extensions that provide fast access to the underlying hardware on the host system.
HVM AMIs are required to take advantage of enhanced networking and GPU processing. In order to pass through instructions to specialized network and GPU devices, the OS needs to be able to have access to the native hardware platform; HVM virtualization provides this access.
All current generation instance types support HVM AMIs only. HVM is the only virtualization type supported on Nitro-based instances.
PV AMIs
PV AMIs are legacy. Historically, PV guests had better performance than HVM guests in many cases, but because of enhancements in HVM virtualization and the availability of PV drivers for HVM AMIs, this is no longer true.
PV AMIs boot with a special boot loader called PV-GRUB, which starts the boot cycle and then chain loads the kernel specified in the menu.lst file on your image.
Paravirtual guests can run on host hardware that does not have explicit support for virtualization, but they cannot take advantage of special hardware extensions such as enhanced networking or GPU processing
PV is only supported on older instance types such as C1, C3, M1, M2, M3, and T1.
AMI Lifecycle
AMI lifecycle includes the following stages:
Create and register an AMI
Launch new instances (You can also launch instances from an AMI if the AMI owner grants you launch permissions)
Copy an AMI to the same region or to different regions
Deprecate the AMI to mark it as outdated
Disable the AMI to prevent new launches while retaining it
Deregister the AMI when no longer needed
AMI Deprecation
An AMI can be deprecated to indicate that it is out of date and should not be used.
Deprecated AMIs are hidden from AMI listings, but users and services can continue to use deprecated AMIs if they know the AMI ID.
Public AMIs are automatically deprecated after 2 years from their creation date.
Deprecation can be set to a future date (up to 10 years for private AMIs, 2 years for public AMIs).
Deprecation does not affect running instances launched from the AMI.
AMI Disable
An AMI can be disabled to prevent new instance launches while retaining the AMI and its snapshots.
Disabling an AMI changes its state to disabled, makes it private (removes all sharing permissions), and prevents any new EC2 instance launches.
Useful for retaining old AMIs for compliance or audit purposes while preventing accidental usage.
A disabled AMI can be re-enabled later if needed.
AMI Deregistration Protection
AMIs can be marked as protected from accidental deregistration (launched May 2024).
A protected AMI cannot be deregistered until deregistration protection is explicitly disabled.
Supports a 24-hour cooldown period — after disabling protection, you must wait 24 hours before the AMI can be deregistered.
Deregistration protection is turned off by default on all existing and new AMIs.
AMI Creation
EBS-Backed Linux AMI
EBS-Backed Linux AMI can be created from the instance directly or from the EBS snapshot
EBS-backed Linux AMI creation process:-
Select an AMI #1 similar to what you want to have your new AMI #2
Launch an Instance from AMI #1 and configure it accordingly
Stop the instance to ensure data integrity
Create AMI #2 OR create an EBS snapshot and then create an AMI #2 from the snapshot
Amazon automatically register the EBS-backed AMI
AMI #2 can be now used to launch new instances
By default, EC2 shuts down the instance, takes snapshots of any attached volumes, creates and registers the AMI, and then reboots the instance.
No Reboot option
No Reboot option prevents the instance from shut down & reboot
AMI will be crash consistent as all the volumes are snapshotted at the same time
However, AMI is not application consistent as all the operating system buffers are not flushed to disk before the snapshots are created and file system integrity can’t be guaranteed
EC2 creates snapshots of the instance’s root volume and any other EBS volumes attached to the instance. If any volumes attached to the instance are encrypted, the new AMI only launches successfully on instances that support Amazon EBS encryption
For any additional instance-store volumes or EBS volumes, the block device mapping for the new AMI contains information for these volumes and the block device mappings for instances that you launch from the new AMI automatically contain information for these volumes.
While data on EBS volumes persist, the Instance-store volumes specified in the block device mapping for the new instance are new and don’t contain any data from the instance store volumes of the instance you used to create the AMI.
It’s more efficient to create an EBS-backed AMI with EBS snapshots already taken as the snapshot created during AMI creation is just an incremental one
You are charged for the storage of both the image and the snapshots
Instance Store-Backed Linux AMI
Note: Instance store-backed AMIs are considered end of life and not recommended for new usage. They are only supported on C1, C3, D2, I2, M1, M2, M3, R3, and X1 instance types.
Instance Store-Backed Linux AMI creation process
Select an AMI #1 similar to what you want to have your new AMI #2
Launch an Instance from AMI #1 and configure the instance accordingly
Bundle the Instance. It takes several minutes for the bundling process to complete.
After the process completes, you have a bundle, which consists of an image manifest (image.manifest.xml) and files (image.part.xx) that contain a template for the root volume.
Upload the bundle to the S3 bucket
Register the Instance Store-backed AMI.
Launching an instance using the new AMI #2, the root volume for the instance is created using the bundle that you uploaded to S3.
Charges are incurred for the storage space used by the bundle in S3 until deleted
For additional instance store volumes, not root volumes, the block device mapping for the new AMI contains information for these volumes and the block device mappings for instances that you launch from the new AMI automatically contain information for these volumes.
Deregistering AMI
Charges are incurred on the AMI created and they can be deregistered, if not needed.
Deregistering an AMI does not delete the EBS snapshots or the bundles in the S3 buckets and have to be removed separately
Once deregistered, new instances cannot be launched from the AMI. However, it does not impact already created instances from the AMI
An AMI that has deregistration protection enabled cannot be deregistered until protection is disabled.
Clean up EBS-Backed AMI
Deregister the EBS-Backed AMI
Delete the EBS Snapshot, as deregistering the AMI doesn’t impact the snapshot
Clean up Instance Store-backed AMI
Deregister the Instance Store-Backed AMI
Delete the bundle from the S3 bucket, as deregistering the AMI doesn’t affect the bundles stored in the S3 bucket
AMI Lineage and Ancestry
AMI Lineage (launched Nov 2024) provides source details for AMIs, enabling tracing of copied or derived AMIs back to their original source.
AMI Ancestry (launched Nov 2025) extends this by enabling complete lineage tracing from any AMI back to the root AMI through each preceding generation.
Key benefits:
Track AMI derivatives to ensure compliance with internal policies
Identify potentially vulnerable AMIs when a security issue is found in an ancestor AMI
Maintain visibility of AMI origins across multiple Regions
When an AMI is created or copied, the new AMI retains the ID and Region of its source (parent) AMI.
Ancestry information is maintained even if intermediate generation AMIs are deleted.
Use the GetImageAncestry API or describe-image-ancestry CLI command to retrieve lineage information.
AMI Usage Monitoring
Last Launched Time (launched 2022, enhanced May 2024)
Tracks when an AMI was last used to launch an EC2 instance
Helps identify unused AMIs for cleanup and cost optimization
Available via DescribeImages API and EC2 console
AMI Usage Reports (launched Sep 2025)
Generate reports listing accounts using your AMIs in EC2 instances and launch templates
Check utilization of any AMI within your account across instances, launch templates, Image Builder recipes, and SSM parameters
Reports are automatically deleted after 30 days
AMI Governance – Allowed AMIs
Allowed AMIs (launched Dec 2024) is an account-wide setting that enables limiting the discovery and use of AMIs within AWS accounts.
Specify criteria that AMIs must meet to be visible and available within the account.
CreationDateCondition – Maximum age for allowed AMIs
DeprecationTimeCondition – Maximum period since deprecation
Operational states:
Enabled – Criteria enforced, only allowed AMIs visible and launchable
Disabled – No restrictions
Audit mode – Criteria evaluated but not enforced (for testing)
Does NOT restrict AMIs owned by your own account — only controls public AMIs and AMIs shared with your account.
Can be configured via declarative policies in AWS Organizations for multi-account and multi-region enforcement.
Integrates with AWS Config (Mar 2025) using the ec2-instance-launched-with-allowed-ami rule.
AMI Block Public Access
AMI Block Public Access (BPA), launched Sep 2023, is an account-wide setting that prevents public sharing of AMIs in a region.
Enabled by default for all new AWS accounts and existing accounts that have not owned a public AMI since July 2023.
When enabled, prevents making any AMI public in that region.
Existing public AMIs remain publicly available — BPA only blocks new public sharing.
Must be explicitly disabled if you need to share AMIs publicly.
Shared AMIs
Shared AMI is an AMI that can be created and shared with others for use
A Shared AMI with all the components needed can be used to get started and then add custom components as and when needed
Shared AMI can be risky as Amazon does not perform detailed checks and vouch for the integrity and security of these AMIs
Before using a Shared AMI, check for any pre-installed credentials that would allow unwanted access to the instance by a third party and no pre-configured remote logging that could transmit sensitive data to a third party
Amazon allows you to share an image, by defining launch permissions, to all (making it public) or only to specific AWS accounts, Organizations, or Organizational Units (OUs)
Launch permissions work at the AWS account level, or at the AWS Organizations/OU level for broader sharing.
Sharing an image does not affect the ownership of the AMI
Only AMIs with unencrypted volumes or encrypted with a customer-managed key can be shared.
AMIs are a regional resource. Therefore, sharing an image makes it available in that Region. To make an image available in a different Region, copy the AMI to the Region and then share it.
Share with Organizations/OUs
AMIs can be shared with an entire AWS Organization or specific OUs using the Org ID or OU ID in launch permissions.
When shared with an organization or OU, all children accounts gain access to the AMI.
If shared with encrypted snapshots, the Organizations or OUs must also be allowed to use the KMS keys used to encrypt the snapshots.
Make AMI Public
AMIs with encrypted volumes cannot be made public.
AMI with product codes or snapshots of an encrypted volume can’t be made public; they can be shared only with specific AWS accounts.
AMI Block Public Access must be disabled in the region before an AMI can be made public.
Guidelines for Shared Linux AMIs
Update the AMI Tools at Boot-Time
Update the AMI tools or any software during startup.
Take into account the software updates do not break any software and consider the WAN traffic as the downloads will be charged to the AMI user
Disable Password-Based Remote Logins for Root
Fixed root passwords can be a security risk and need to be disabled
Disable Local Root Access
disable direct root logins
Remove SSH Host Key Pairs
Remove the existing SSH host key pairs located in /etc/ssh, which forces SSH to generate new unique SSH key pairs when someone launches an instance using your AMI, improving security and reducing the likelihood of “man-in-the-middle” attacks
Install Public Key Credentials
EC2 allows users to specify a public-private key pair name when launching an instance.
A valid key pair name needs to be provided when launching an instance, the public key, the portion of the key pair that EC2 maintains on the server, is made available to the instance through an HTTP query against the instance metadata and appended to the authorized keys
Users can launch instances of the AMI with a key pair and log in without requiring a root password
Disabling sshd DNS Checks (Optional)
Disabling sshd DNS checks slightly weaken the sshd security. However, if DNS resolution fails, SSH logins still work. If you do not disable sshd checks, DNS resolution failures prevent all logins.
Identify Yourself
AMI is only represented by an account ID without any further information, so it is better to provide more information to help describe the AMI
Protect Yourself
Don’t store any sensitive data or software on the AMI
Exclude & Skip any directories holding sensitive data or secret information and delete the shell history before creating an AMI
AMIs with Encrypted Snapshots
AMIs, with EBS backed snapshots, can be attached with both an encrypted root and data volume
AMIs copy image can be used to create AMIs with encrypted snapshots from AMIs with unencrypted snapshots. By default, copy image preserves the encryption status of the snapshots
Snapshots can be encrypted with either the default AWS managed key or a customer managed KMS key
AMI Copying
EBS-backed AMIs and instance store-backed AMIs can be copied.
Copying an AMI
An identical target AMI is created, but with its own unique identifier
For EBS backed AMI, identical but distinct root and data snapshots are created
Encryption status of the snapshots are preserved
However, Launch permissions, user-defined tags, or S3 bucket permissions are not copied from the source AMI to the new AMI. After the copy operation is complete, different launch permissions, user-defined tags, and S3 bucket permissions to the new AMI
Source AMI can be deregistered without any impact to the Target AMI
AMIs owned or shared with proper permissions can be copied
AMIs are created specific to a region and can be copied within or across regions which can help to aid in the consistent global deployment and build highly scalable and available applications
AMI copy image can be used to encrypt an AMI from an unencrypted AMI
AMIs with encrypted snapshots can be copied and also encryption status changed during the copy process.
AWS Marketplace AMI cannot be copied, regardless of whether obtained directly or shared. Instead, launch an EC2 instance using the AWS Marketplace AMI and then create an AMI from the instance.
AMI Lineage is maintained through copies — the copied AMI retains the source AMI ID and Region for tracking.
Amazon Linux 2023
⚠️ Amazon Linux Version Status:
Amazon Linux 1 (AL1) reached End of Life on December 31, 2023. No security updates since January 1, 2024.
Amazon Linux 2 (AL2) will reach End of Life on June 30, 2026. Migrate to AL2023.
Amazon Linux 2023 (AL2023) is the current recommended version with support until June 30, 2029.
Amazon Linux 2023 (AL2023)
Amazon Linux 2023 is the latest generation of Amazon Linux, a cloud-optimized Linux distribution with long-term support provided by AWS.
A stable, secure, and high-performance execution environment for applications running on EC2.
does not allow remote root SSH by default.
Password authentication is disabled to prevent brute-force password attacks.
Instances launched using Amazon Linux AMI must be provided with a key pair at launch to enable SSH logins
Inbound security group must allow SSH access
By default, the only account that can log in remotely using SSH is ec2-user; this account also has sudo privileges.
are configured to download and install security updates at launch time.
Provided at no additional charge to Amazon EC2 users.
Key improvements over Amazon Linux 2:
Deterministic updates through versioned repositories (locking to a specific version)
FIPS 140-3 certification for enhanced security compliance
Kernel livepatch support for applying security patches without rebooting
SELinux support in permissive mode by default
Uses dnf package manager (replaces yum)
Uses IMDSv2 by default (Instance Metadata Service Version 2)
Modern system components with regular major version updates
Support lifecycle: 5 years per major version (2 years standard + 3 years maintenance)
Includes pre-installed packages to enable easy integration with AWS services, such as the AWS CLI, Amazon EC2 API tools, the Boto3 library for Python, and SSM Agent.
Amazon Linux 2 (AL2) – End of Life June 30, 2026
Amazon Linux 2 continues to receive maintenance updates until June 30, 2026.
AWS recommends migrating to Amazon Linux 2023 for new workloads.
ECS-optimized AL2 AMIs and EKS-optimized AL2 AMIs also end support in 2025-2026.
EC2 Image Builder is a fully managed AWS service that makes it easier to automate the creation, management, and deployment of customized, secure, and up-to-date server images that are pre-installed and pre-configured with software and settings to meet specific IT standards
EC2 Image Builder simplifies the building, testing, and deployment of Virtual Machine and container images for use on AWS or on-premises.
Image Builder significantly reduces the effort of keeping images up-to-date and secure by providing a simple graphical interface, built-in automation, and AWS-provided security settings.
Image Builder removes any manual steps for updating an image and you do not have to build your own automation pipeline.
Image Builder provides a one-stop-shop to build, secure, and test up-to-date Virtual Machine and container images using common workflows.
Image Builder allows image validation for functionality, compatibility, and security compliance with AWS-provided tests and your own tests before using them in production.
Image Builder is offered at no cost, other than the cost of the underlying AWS resources used to create, store, and share the images.
Lifecycle Management (launched Nov 2023)
Automates deprecating, disabling, and deleting outdated images and associated resources
Supports wildcard patterns in lifecycle policies (enhanced Feb 2026)
Helps save costs by cleaning up unused images that accumulate storage charges
Flexible AMI Distribution (launched Nov 2025)
Distribute existing AMIs to multiple regions and accounts without running a full pipeline build
Specify AMI and distribution configuration, and Image Builder handles copying and sharing
AWS Marketplace Components (launched 2025)
Procure third-party components from AWS Marketplace directly in the Image Builder console
Streamlines AMI creation with pre-built software components
Pipeline Management Enhancements (launched Oct 2025)
Automatically disables pipelines after consecutive failures
Custom log groups for image pipelines for better visibility
Supports sharing AMIs with AWS Organizations and Organizational Units
AWS Certification Exam Practice Questions
Questions are collected from Internet and the answers are marked as per my knowledge and understanding (which might differ with yours).
AWS services are updated everyday and both the answers and questions might be outdated soon, so research accordingly.
AWS exam questions are not updated to keep up the pace with AWS updates, so even if the underlying feature has changed the question might not be updated
Open to further feedback, discussion and correction.
A user has launched an EC2 instance from an instance store backed AMI. The infrastructure team wants to create an AMI from the running instance. Which of the below mentioned credentials is not required while creating the AMI?
AWS account ID
509 certificate and private key
AWS login ID to login to the console
Access key and secret access key
A user has launched an EC2 Windows instance from an instance store backed AMI. The user wants to convert the AMI to an EBS backed AMI. How can the user convert it?
Attach an EBS volume to the instance and unbundle all the AMI bundled data inside the EBS
A Windows based instance store backed AMI cannot be converted to an EBS backed AMI
It is not possible to convert an instance store backed AMI to an EBS backed AMI
Attach an EBS volume and use the copy command to copy all the ephemeral content to the EBS Volume
A user has launched two EBS backed EC2 instances in the US-East-1a region. The user wants to change the zone of one of the instances. How can the user change it?
Stop one of the instances and change the availability zone
The zone can only be modified using the AWS CLI
From the AWS EC2 console, select the Actions – > Change zones and specify new zone
Create an AMI of the running instance and launch the instance in a separate AZ
A user has launched a large EBS backed EC2 instance in the US-East-1a region. The user wants to achieve Disaster Recovery (DR) for that instance by creating another small instance in Europe. How can the user achieve DR?
Copy the running instance using the “Instance Copy” command to the EU region
Create an AMI of the instance and copy the AMI to the EU region. Then launch the instance from the EU AMI
Copy the instance from the US East region to the EU region
Use the “Launch more like this” option to copy the instance from one region to another
A user has launched an EC2 instance store backed instance in the US-East-1a zone. The user created AMI #1 and copied it to the Europe region. After that, the user made a few updates to the application running in the US-East-1a zone. The user makes an AMI#2 after the changes. If the user launches a new instance in Europe from the AMI #1 copy, which of the below mentioned statements is true?
The new instance will have the changes made after the AMI copy as AWS just copies the reference of the original AMI during the copying. Thus, the copied AMI will have all the updated data
The new instance will have the changes made after the AMI copy since AWS keeps updating the AMI
It is not possible to copy the instance store backed AMI from one region to another
The new instance in the EU region will not have the changes made after the AMI copy
George has shared an EC2 AMI created in the US East region from his AWS account with Stefano. George copies the same AMI to the US West region. Can Stefano access the copied AMI of George’s account from the US West region?
No, copy AMI does not copy the permission
It is not possible to share the AMI with a specific account
Yes, since copy AMI copies all private account sharing permissions
Yes, since copy AMI copies all the permissions attached with the AMI
EC2 instances are launched from Amazon Machine images (AMIS). A given public AMI can:
be used to launch EC2 Instances in any AWS region.
only be used to launch EC2 instances in the same country as the AMI is stored.
only be used to launch EC2 instances in the same AWS region as the AMI is stored. (An AMI is tied to the region where its files are located within Amazon S3)
only be used to launch EC2 instances in the same AWS availability zone as the AMI is stored.
A company wants to ensure that only approved AMIs can be used to launch EC2 instances in their AWS account. They want to restrict the use of community AMIs and only allow AMIs from trusted providers. Which feature should they use?
AMI Block Public Access
AMI Deprecation
Allowed AMIs
AMI Deregistration Protection
An organization needs to track the complete lineage of an AMI that has been copied across multiple regions over several years. Which AWS feature provides this capability?
AMI Last Launched Time
AMI Usage Reports
AMI Deprecation
AMI Ancestry
A team wants to prevent critical production AMIs from being accidentally deregistered while still allowing cleanup of development AMIs. What is the most appropriate approach?
Use IAM policies to deny DeregisterImage on all AMIs
Disable the AMIs instead of deregistering them
Enable deregistration protection on production AMIs
Use AMI Block Public Access
Which of the following statements about Amazon Linux versions is correct? (Choose 2)
Amazon Linux 1 continues to receive security updates
Amazon Linux 2023 is supported until June 2029
Amazon Linux 2 has no announced end of life date
Amazon Linux 2 reaches end of life on June 30, 2026
Amazon Linux 2023 uses yum as its package manager
A security team wants to disable an old AMI so no new instances can be launched from it, but needs to retain it for compliance auditing. Which approach should they use?
CloudWatch Agent is a unified software component that collects metrics, logs, and traces from EC2 instances, on-premises servers, and containerized applications and sends them to CloudWatch and AWS X-Ray.
CloudWatch agent helps to
Collect internal system-level metrics from EC2 instances across operating systems. The metrics can include in-guest metrics, in addition to the metrics for EC2 instances.
Collect system-level metrics from on-premises servers. These can include servers in a hybrid environment as well as servers not managed by AWS.
Retrieve custom metrics from the applications or services using the StatsD and collectd protocols. StatsD is supported on both Linux servers and servers running Windows Server. collectd is supported only on Linux servers.
Collect logs from EC2 instances and on-premises servers, running either Linux or Windows Server.
Collect traces from OpenTelemetry or X-Ray client SDKs and send them to AWS X-Ray (agent version 1.300025.0 and later).
Collect metrics for individual processes using the procstat plugin stored in the procstat namespace.
Collect NVIDIA GPU metrics including utilization, memory usage, temperature, and power draw from accelerated EC2 instances.
Default namespace for metrics collected by the agent is CWAgent, although a different namespace can be configured.
Logs collected by the unified agent are processed and stored in CloudWatch Logs.
Agent can be installed on Amazon Linux 2, Amazon Linux 2023, and all supported operating systems (Linux, Windows Server, macOS), manually or using AWS Systems Manager.
CloudWatch agent needs permissions to write metrics/logs to CloudWatch and traces to X-Ray. An IAM role for EC2 instances or an IAM user for on-premises servers should be assigned.
AWS provides managed IAM policies for the agent:
CloudWatchAgentServerPolicy – allows the agent to read configuration from SSM Parameter Store and publish metrics, logs, and traces to CloudWatch and X-Ray. Attach to all instances running the agent.
CloudWatchAgentAdminPolicy – includes additional permissions to write agent configuration to SSM Parameter Store. Attach only to the instance used for creating/storing agent configuration.
The older CloudWatch Logs agent (awslogs) is deprecated and no longer supported. Use the unified CloudWatch agent instead.
CloudWatch Agent Configuration
Agent configuration is defined in a JSON file with three main sections:
agent – general configuration such as metrics collection interval, run_as_user, and debug logging.
metrics – specifies which system-level and custom metrics to collect.
logs – specifies which log files or Windows event logs to collect.
traces – configures trace collection using OpenTelemetry Protocol (OTLP) or X-Ray SDK.
Configuration can be created using the agent configuration wizard (amazon-cloudwatch-agent-config-wizard).
Configuration can be stored in AWS Systems Manager Parameter Store for centralized fleet management. Parameter names must start with AmazonCloudWatch-.
Multiple configuration files can be appended together for modular configuration management.
In-Console Agent Management (2025)
CloudWatch provides an in-console experience for automated installation and configuration of the agent on EC2 instances (launched November 2025).
Features include:
Fleet Visibility – view agent status across your entire EC2 fleet.
Automatic Workload Detection – detects running applications and services (NGINX, Tomcat, JVM, Kafka, NVIDIA GPU) and recommends monitoring configurations.
One-Click Installation – deploy the agent to individual instances without manual SSH or SSM commands.
Tag-Based Policies – create automated fleet-wide management policies that apply to new instances, including auto-scaling instances.
Visual Configuration Editor (April 2026) – build agent configurations graphically, selecting metrics, log sources, and deployment targets without hand-editing JSON.
Accessible from the EC2 console → instance detail page → Monitoring tab.
Available in all AWS Commercial Regions at no additional cost (standard CloudWatch pricing applies for collected telemetry).
OpenTelemetry and Traces Support
CloudWatch agent version 1.300025.0+ supports collecting traces from OpenTelemetry SDKs or X-Ray client SDKs.
Supports the OpenTelemetry Protocol (OTLP) for receiving metrics and traces.
Can act as an OTLP collector endpoint, allowing applications instrumented with OpenTelemetry to send telemetry directly to the CloudWatch agent.
Traces are sent to AWS X-Ray for distributed tracing and service map visualization.
Metrics received via OTLP are published to CloudWatch Metrics.
Enables single-agent deployment replacing the need for separate X-Ray daemon and ADOT collector in many scenarios.
CloudWatch Observability Solutions
CloudWatch provides pre-built observability solutions (launched November 2024) that offer workload-specific agent configurations and dashboards.
Available solutions include:
Amazon EC2 Health – system-level metrics and dashboards.
NVIDIA GPU on EC2 – GPU utilization, memory, temperature, and power metrics.
NGINX on EC2 – web server monitoring with traffic analysis.
Apache Tomcat on EC2 – server monitoring with JVM performance metrics.
JVM on EC2 – Java Virtual Machine heap, GC, and thread metrics.
Apache Kafka on EC2 – broker and topic monitoring.
Each solution includes pre-configured agent configuration, recommended metrics, and a curated CloudWatch dashboard.
Solutions are deployed through the in-console agent management experience.
Container Insights Integration
CloudWatch agent is used for Container Insights to collect infrastructure metrics from containerized workloads.
Amazon EKS:
Deployed via the Amazon CloudWatch Observability EKS add-on.
Collects cluster, node, pod, and container-level metrics.
Container Insights with enhanced observability provides additional dimensions and deep container-level visibility.
Supports Windows worker nodes.
Amazon ECS:
Container Insights with enhanced observability for ECS (December 2024) supports EC2 and Fargate launch types.
Auto-collects detailed infrastructure telemetry from cluster level down to container level.
Provides curated dashboards for faster problem isolation.
CloudWatch Application Signals
Application Signals is an APM capability that uses the CloudWatch agent for automatic instrumentation of applications.
Automatically collects metrics and traces without code changes using AWS Distro for OpenTelemetry (ADOT) auto-instrumentation.
Provides key metrics: call volume, availability, latency, faults, and errors.
Supports Java, Python, .NET, and Node.js applications.
Works on EKS (with auto-monitor support since May 2025), ECS, and EC2.
Enables Service Level Objectives (SLOs) for tracking application performance against business goals.
AWS Certification Exam Practice Questions
Questions are collected from Internet and the answers are marked as per my knowledge and understanding (which might differ with yours).
AWS services are updated everyday and both the answers and questions might be outdated soon, so research accordingly.
AWS exam questions are not updated to keep up the pace with AWS updates, so even if the underlying feature has changed the question might not be updated
Open to further feedback, discussion and correction.
A company has a set of servers sitting in AWS and a set of them sitting in their On-premise locations. They want to monitor the system-level metrics for both sets of servers and have a unified dashboard for monitoring. As a system administrator, which of the following can help in this regard?
Install the CloudWatch agent on both sets of servers
Migrate the on-premise servers to AWS to ensure they can be monitored
Setup the metrics dashboard in CloudWatch
Setup the metrics dashboard in AWS Inspector
Setup the metrics dashboard in AWS Config
A Developer has a legacy application that is hosted on-premises. Other applications hosted on AWS depend on the on-premises application for proper functioning. In case of any application errors, the Developer wants to be able to use Amazon CloudWatch to monitor and troubleshoot all applications from one place. How can the Developer accomplish this?
Install an AWS SDK on the on-premises server to automatically send logs to CloudWatch.
Download the CloudWatch agent to the on-premises server. Configure the agent to use IAM user credentials with permissions for CloudWatch.
Upload log files from the on-premises server to Amazon S3 and have CloudWatch read the files.
Upload log files from the on-premises server to an Amazon EC2 instance and have the instance forward the logs to CloudWatch.
A company runs a fleet of EC2 instances hosting Java applications behind an Application Load Balancer. The operations team needs to monitor application-level metrics such as JVM heap usage, garbage collection times, and thread counts in CloudWatch. What is the MOST operationally efficient approach?
Write a custom script to parse JVM metrics and publish them using the PutMetricData API.
Use the CloudWatch agent with the JVM observability solution to automatically collect and visualize JVM metrics.
Install a third-party monitoring agent and export metrics to CloudWatch using metric streams.
Enable detailed monitoring on the EC2 instances to capture JVM metrics.
A DevOps engineer needs to deploy the CloudWatch agent across 200 EC2 instances with consistent configuration. The instances are launched by Auto Scaling groups, and new instances must automatically receive the same monitoring configuration. What approach should the engineer use?
Include the agent installation in the AMI and store the configuration file locally on each instance.
Use a Lambda function triggered by Auto Scaling lifecycle hooks to install and configure the agent.
Store the agent configuration in SSM Parameter Store and use the in-console agent management with tag-based policies for automated fleet-wide deployment.
Create a cron job on each instance to pull the latest configuration from S3 every hour.
A company wants to collect both application traces and system metrics from their EC2 instances using a single agent. They are using OpenTelemetry-instrumented applications. Which CloudWatch agent capability supports this requirement?
Configure the CloudWatch agent with StatsD protocol to receive trace data.
Install both the CloudWatch agent and X-Ray daemon as separate processes.
Configure the CloudWatch agent (version 1.300025.0+) with OTLP support to collect both metrics and traces, sending traces to X-Ray.
Use CloudWatch Embedded Metric Format to combine traces with metric data.
Macie is a data security service that discovers sensitive data by using machine learning and pattern matching, provides visibility into data security risks, and enables automated protection against those risks.
provides an inventory of the S3 general purpose buckets and automatically evaluates and monitors the buckets for security and access control.
automates the discovery, classification, and reporting of sensitive data.
generates a finding for you to review and remediate as necessary if it detects a potential issue with the security or privacy of the data, such as a bucket that becomes publicly accessible.
provides multi-account support using AWS Organizations to enable Macie across all of the accounts.
is a regional service and must be enabled on a region-by-region basis and helps view findings across all the accounts within each Region.
can perform preventative control monitoring for up to 10,000 S3 general purpose buckets per account.
stores policy and sensitive data findings for 90 days.
offers a 30-day free trial that includes automated sensitive data discovery and S3 bucket-level evaluation, plus 1 GB of data processed per month at no cost (free tier does not expire).
integrates with AWS Security Hub, Amazon EventBridge, and AWS User Notifications for centralized monitoring and remediation.
Macie Sensitive Data Discovery
Macie provides two ways to discover sensitive data:
Automated Sensitive Data Discovery – continuously evaluates S3 bucket inventory, samples and analyzes representative objects, and builds sensitivity profiles for each bucket.
Sensitive Data Discovery Jobs – on-demand, daily, weekly, or monthly jobs that analyze all or a subset of objects in specified S3 buckets.
Macie uses Managed Data Identifiers (built-in ML and pattern matching) to detect common sensitive data types including:
Personally identifiable information (PII) – names, addresses, passport numbers, national IDs
Financial data – credit card numbers, bank account numbers, IBANs (50+ countries)
Credentials – AWS secret keys, API keys (Google Cloud, Stripe), HTTP authorization headers, JSON Web Tokens
Custom Data Identifiers allow detection of organization-specific sensitive data using regex patterns, keywords, and proximity rules.
Allow Lists define text or patterns for Macie to ignore, enabling exceptions for known safe data (e.g., public representative names, test data).
Macie supports analysis of objects encrypted with SSE-S3, SSE-KMS, and DSSE-KMS (dual-layer server-side encryption).
Supports S3 storage classes including Standard, Intelligent-Tiering, and S3 Glacier Instant Retrieval.
Automated Sensitive Data Discovery
Continually evaluates and samples S3 objects across all buckets, providing ongoing discovery without manual job creation.
Builds an interactive data map of where sensitive data resides across accounts.
Provides a sensitivity score for each bucket (1-100) with a corresponding sensitivity label.
Administrators can enable/disable automated discovery for individual accounts in an organization.
Member accounts have read access to statistics and inventory data produced by automated discovery.
Uses a dynamic, recommended default set of managed data identifiers optimized for common sensitive data categories.
Resource coverage page provides unified view of coverage statistics and remediation guidance for analysis issues.
Sensitive Data Discovery Jobs
Jobs can analyze data across up to 1,000 buckets spanning up to 1,000 accounts in an organization.
Can specify which managed data identifiers a job should use, or use the recommended set.
Support runtime criteria for dynamic bucket selection based on inventory changes.
Can use S3 object prefixes for custom include/exclude criteria to refine scope.
Jobs can be paused and resumed.
Estimated costs are calculated and displayed during job creation.
CloudWatch Logs can be used to monitor and analyze events during job execution.
Macie Findings
Macie generates two categories of findings:
Policy Findings – from continuous monitoring of S3 bucket configurations and policies (no active scanning required).
Sensitive Data Findings – from discovery jobs or automated discovery that inspects object content.
Policy finding types include:
Policy:IAMUser/S3BlockPublicAccessDisabled
Policy:IAMUser/S3BucketPublic
Policy:IAMUser/S3BucketReplicatedExternally
Policy:IAMUser/S3BucketSharedExternally
Policy:IAMUser/S3BucketSharedWithCloudFront – indicates bucket shared with CloudFront OAI or OAC.
Policy:IAMUser/S3BucketEncryptionDisabled
Findings are retained for 90 days and can be viewed in the console or via API.
Findings can be published to AWS Security Hub and Amazon EventBridge for centralized monitoring.
Findings are consolidated by object or bucket with severity-based prioritization.
Sensitive Data Samples – Macie can retrieve and reveal samples of sensitive data reported in findings to verify the nature of detected data. Supports configuring an IAM role for cross-account access.
Suppression rules (filter rules) can be used to automatically archive findings that match specific criteria.
Macie Multiple Accounts
Macie provides multi-account support using AWS Organizations to enable Macie across all of the accounts.
An organization consists of a designated administrator account and one or more associated member accounts.
Accounts can be associated in two ways,
by integrating AWS Organizations (Recommended) or
by sending and accepting membership invitations
The designated administrator can assess and monitor the overall security posture of the organization’s S3 data estate, and discover sensitive data in the organization’s S3 buckets.
The administrator can also perform various account management and administration tasks at scale, such as monitoring estimated usage costs and assessing account quotas.
Can manage Macie for up to 10,000 accounts in an organization.
Administrator can enable/disable automated sensitive data discovery for individual accounts or all accounts selectively.
Macie Integration with AWS Security Hub
Macie publishes both policy findings and sensitive data findings to AWS Security Hub.
Security Hub provides security controls that check:
Macie.1 – whether Macie is enabled for an AWS account.
Macie.2 – whether automated sensitive data discovery is enabled for a Macie account.
Integrates with AWS User Notifications for configuring custom notification rules and delivery channels.
Macie Pricing
Charged based on three dimensions:
Number of S3 buckets evaluated for bucket inventory and monitoring (up to 10,000 per account).
Number of S3 objects monitored for automated data discovery.
Quantity of data inspected for sensitive data discovery jobs.
30-day free trial includes automated sensitive data discovery and S3 bucket-level security evaluation.
1 GB of data processed per month at no cost (perpetual free tier, not limited to trial).
AWS Certification Exam Practice Questions
Questions are collected from Internet and the answers are marked as per my knowledge and understanding (which might differ with yours).
AWS services are updated everyday and both the answers and questions might be outdated soon, so research accordingly.
AWS exam questions are not updated to keep up the pace with AWS updates, so even if the underlying feature has changed the question might not be updated
Open to further feedback, discussion and correction.
Which AWS service makes it easy to automate the process of discovering, classifying, and protecting data stored in AWS?
AWS Shield
AWS WAF
AWS GuardDuty
AWS Macie
A company needs to continuously monitor its S3 buckets for sensitive data such as PII and financial information across multiple AWS accounts. They want an automated solution that provides sensitivity scores and an interactive data map. Which approach should they use?
Create individual S3 event notifications for each bucket
Enable Amazon Macie automated sensitive data discovery across the organization
Write custom Lambda functions to scan S3 objects on upload
Use AWS Config rules to check for sensitive data
A security team wants to identify sensitive data in S3 that matches their company’s proprietary data formats, in addition to standard PII detection. Which Macie feature should they use?
Managed data identifiers only
Custom data identifiers with regex patterns and keywords
S3 Object Lock
AWS Config custom rules
An organization is using Macie and wants to prevent findings from being generated for known safe data patterns, such as test credit card numbers used in development environments. What should they configure?
Suppression rules
Custom data identifiers with exclusion patterns
Allow lists
IAM policies to restrict Macie access to development buckets
How does Amazon Macie integrate with AWS Security Hub? (Select TWO)
Macie publishes policy and sensitive data findings to Security Hub
Security Hub triggers Macie scans automatically
Security Hub provides controls to verify Macie is enabled (Macie.1) and automated discovery is active (Macie.2)
Security Hub manages Macie pricing
Macie uses Security Hub to store discovery results