Amazon CloudWatch Agent
- CloudWatch Agent is a unified software component that collects metrics, logs, and traces from EC2 instances, on-premises servers, and containerized applications and sends them to CloudWatch and AWS X-Ray.
- CloudWatch agent helps to
- Collect internal system-level metrics from EC2 instances across operating systems. The metrics can include in-guest metrics, in addition to the metrics for EC2 instances.
- Collect system-level metrics from on-premises servers. These can include servers in a hybrid environment as well as servers not managed by AWS.
- Retrieve custom metrics from the applications or services using the
StatsDandcollectdprotocols.StatsDis supported on both Linux servers and servers running Windows Server.collectdis supported only on Linux servers. - Collect logs from EC2 instances and on-premises servers, running either Linux or Windows Server.
- Collect traces from OpenTelemetry or X-Ray client SDKs and send them to AWS X-Ray (agent version 1.300025.0 and later).
- Collect metrics for individual processes using the
procstatplugin stored in theprocstatnamespace. - Collect NVIDIA GPU metrics including utilization, memory usage, temperature, and power draw from accelerated EC2 instances.
- Default namespace for metrics collected by the agent is
CWAgent, although a different namespace can be configured. - Logs collected by the unified agent are processed and stored in CloudWatch Logs.
- Agent can be installed on Amazon Linux 2, Amazon Linux 2023, and all supported operating systems (Linux, Windows Server, macOS), manually or using AWS Systems Manager.
- CloudWatch agent needs permissions to write metrics/logs to CloudWatch and traces to X-Ray. An IAM role for EC2 instances or an IAM user for on-premises servers should be assigned.
- AWS provides managed IAM policies for the agent:
- CloudWatchAgentServerPolicy – allows the agent to read configuration from SSM Parameter Store and publish metrics, logs, and traces to CloudWatch and X-Ray. Attach to all instances running the agent.
- CloudWatchAgentAdminPolicy – includes additional permissions to write agent configuration to SSM Parameter Store. Attach only to the instance used for creating/storing agent configuration.
- The older CloudWatch Logs agent (awslogs) is deprecated and no longer supported. Use the unified CloudWatch agent instead.
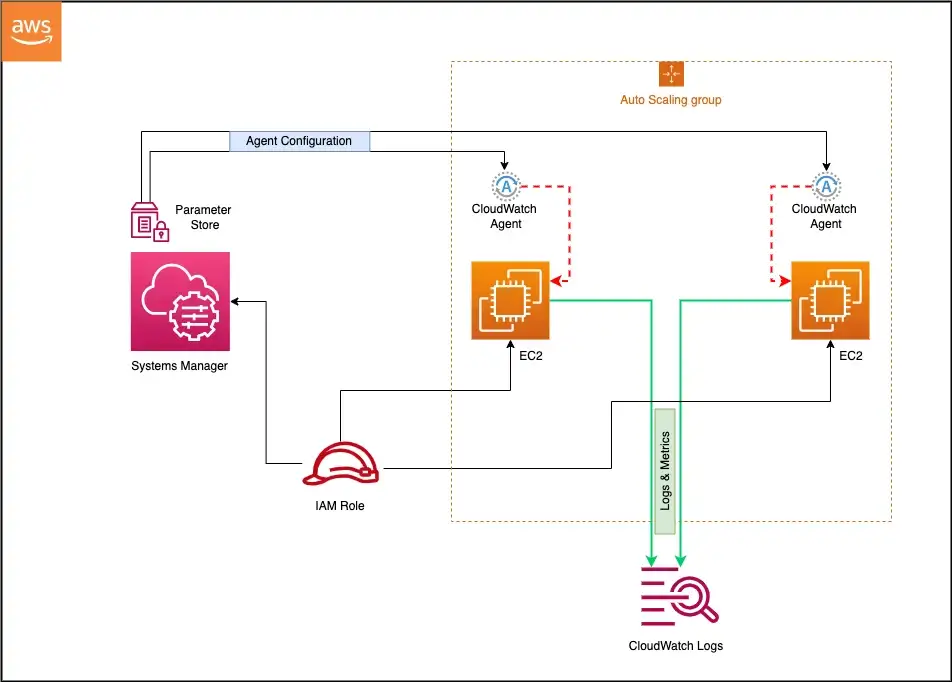
CloudWatch Agent Configuration
- Agent configuration is defined in a JSON file with three main sections:
- agent – general configuration such as metrics collection interval, run_as_user, and debug logging.
- metrics – specifies which system-level and custom metrics to collect.
- logs – specifies which log files or Windows event logs to collect.
- traces – configures trace collection using OpenTelemetry Protocol (OTLP) or X-Ray SDK.
- Configuration can be created using the agent configuration wizard (
amazon-cloudwatch-agent-config-wizard). - Configuration can be stored in AWS Systems Manager Parameter Store for centralized fleet management. Parameter names must start with
AmazonCloudWatch-. - Multiple configuration files can be appended together for modular configuration management.
In-Console Agent Management (2025)
- CloudWatch provides an in-console experience for automated installation and configuration of the agent on EC2 instances (launched November 2025).
- Features include:
- Fleet Visibility – view agent status across your entire EC2 fleet.
- Automatic Workload Detection – detects running applications and services (NGINX, Tomcat, JVM, Kafka, NVIDIA GPU) and recommends monitoring configurations.
- One-Click Installation – deploy the agent to individual instances without manual SSH or SSM commands.
- Tag-Based Policies – create automated fleet-wide management policies that apply to new instances, including auto-scaling instances.
- Visual Configuration Editor (April 2026) – build agent configurations graphically, selecting metrics, log sources, and deployment targets without hand-editing JSON.
- Accessible from the EC2 console → instance detail page → Monitoring tab.
- Available in all AWS Commercial Regions at no additional cost (standard CloudWatch pricing applies for collected telemetry).
OpenTelemetry and Traces Support
- CloudWatch agent version 1.300025.0+ supports collecting traces from OpenTelemetry SDKs or X-Ray client SDKs.
- Supports the OpenTelemetry Protocol (OTLP) for receiving metrics and traces.
- Can act as an OTLP collector endpoint, allowing applications instrumented with OpenTelemetry to send telemetry directly to the CloudWatch agent.
- Traces are sent to AWS X-Ray for distributed tracing and service map visualization.
- Metrics received via OTLP are published to CloudWatch Metrics.
- Enables single-agent deployment replacing the need for separate X-Ray daemon and ADOT collector in many scenarios.
CloudWatch Observability Solutions
- CloudWatch provides pre-built observability solutions (launched November 2024) that offer workload-specific agent configurations and dashboards.
- Available solutions include:
- Amazon EC2 Health – system-level metrics and dashboards.
- NVIDIA GPU on EC2 – GPU utilization, memory, temperature, and power metrics.
- NGINX on EC2 – web server monitoring with traffic analysis.
- Apache Tomcat on EC2 – server monitoring with JVM performance metrics.
- JVM on EC2 – Java Virtual Machine heap, GC, and thread metrics.
- Apache Kafka on EC2 – broker and topic monitoring.
- Each solution includes pre-configured agent configuration, recommended metrics, and a curated CloudWatch dashboard.
- Solutions are deployed through the in-console agent management experience.
Container Insights Integration
- CloudWatch agent is used for Container Insights to collect infrastructure metrics from containerized workloads.
- Amazon EKS:
- Deployed via the Amazon CloudWatch Observability EKS add-on.
- Collects cluster, node, pod, and container-level metrics.
- Container Insights with enhanced observability provides additional dimensions and deep container-level visibility.
- Supports Windows worker nodes.
- Amazon ECS:
- Container Insights with enhanced observability for ECS (December 2024) supports EC2 and Fargate launch types.
- Auto-collects detailed infrastructure telemetry from cluster level down to container level.
- Provides curated dashboards for faster problem isolation.
CloudWatch Application Signals
- Application Signals is an APM capability that uses the CloudWatch agent for automatic instrumentation of applications.
- Automatically collects metrics and traces without code changes using AWS Distro for OpenTelemetry (ADOT) auto-instrumentation.
- Provides key metrics: call volume, availability, latency, faults, and errors.
- Supports Java, Python, .NET, and Node.js applications.
- Works on EKS (with auto-monitor support since May 2025), ECS, and EC2.
- Enables Service Level Objectives (SLOs) for tracking application performance against business goals.
AWS Certification Exam Practice Questions
- Questions are collected from Internet and the answers are marked as per my knowledge and understanding (which might differ with yours).
- AWS services are updated everyday and both the answers and questions might be outdated soon, so research accordingly.
- AWS exam questions are not updated to keep up the pace with AWS updates, so even if the underlying feature has changed the question might not be updated
- Open to further feedback, discussion and correction.
- A company has a set of servers sitting in AWS and a set of them sitting in their On-premise locations. They want to monitor the system-level metrics for both sets of servers and have a unified dashboard for monitoring. As a system administrator, which of the following can help in this regard?
- Install the CloudWatch agent on both sets of servers
- Migrate the on-premise servers to AWS to ensure they can be monitored
- Setup the metrics dashboard in CloudWatch
- Setup the metrics dashboard in AWS Inspector
- Setup the metrics dashboard in AWS Config
- A Developer has a legacy application that is hosted on-premises. Other applications hosted on AWS depend on the on-premises application for proper functioning. In case of any application errors, the Developer wants to be able to use Amazon CloudWatch to monitor and troubleshoot all applications from one place. How can the Developer accomplish this?
- Install an AWS SDK on the on-premises server to automatically send logs to CloudWatch.
- Download the CloudWatch agent to the on-premises server. Configure the agent to use IAM user credentials with permissions for CloudWatch.
- Upload log files from the on-premises server to Amazon S3 and have CloudWatch read the files.
- Upload log files from the on-premises server to an Amazon EC2 instance and have the instance forward the logs to CloudWatch.
- A company runs a fleet of EC2 instances hosting Java applications behind an Application Load Balancer. The operations team needs to monitor application-level metrics such as JVM heap usage, garbage collection times, and thread counts in CloudWatch. What is the MOST operationally efficient approach?
- Write a custom script to parse JVM metrics and publish them using the PutMetricData API.
- Use the CloudWatch agent with the JVM observability solution to automatically collect and visualize JVM metrics.
- Install a third-party monitoring agent and export metrics to CloudWatch using metric streams.
- Enable detailed monitoring on the EC2 instances to capture JVM metrics.
- A DevOps engineer needs to deploy the CloudWatch agent across 200 EC2 instances with consistent configuration. The instances are launched by Auto Scaling groups, and new instances must automatically receive the same monitoring configuration. What approach should the engineer use?
- Include the agent installation in the AMI and store the configuration file locally on each instance.
- Use a Lambda function triggered by Auto Scaling lifecycle hooks to install and configure the agent.
- Store the agent configuration in SSM Parameter Store and use the in-console agent management with tag-based policies for automated fleet-wide deployment.
- Create a cron job on each instance to pull the latest configuration from S3 every hour.
- A company wants to collect both application traces and system metrics from their EC2 instances using a single agent. They are using OpenTelemetry-instrumented applications. Which CloudWatch agent capability supports this requirement?
- Configure the CloudWatch agent with StatsD protocol to receive trace data.
- Install both the CloudWatch agent and X-Ray daemon as separate processes.
- Configure the CloudWatch agent (version 1.300025.0+) with OTLP support to collect both metrics and traces, sending traces to X-Ray.
- Use CloudWatch Embedded Metric Format to combine traces with metric data.
One thought on “Amazon CloudWatch Agent”
Comments are closed.