CloudWatch Agent is a unified software component that collects metrics, logs, and traces from EC2 instances, on-premises servers, and containerized applications and sends them to CloudWatch and AWS X-Ray.
CloudWatch agent helps to
Collect internal system-level metrics from EC2 instances across operating systems. The metrics can include in-guest metrics, in addition to the metrics for EC2 instances.
Collect system-level metrics from on-premises servers. These can include servers in a hybrid environment as well as servers not managed by AWS.
Retrieve custom metrics from the applications or services using the StatsD and collectd protocols. StatsD is supported on both Linux servers and servers running Windows Server. collectd is supported only on Linux servers.
Collect logs from EC2 instances and on-premises servers, running either Linux or Windows Server.
Collect traces from OpenTelemetry or X-Ray client SDKs and send them to AWS X-Ray (agent version 1.300025.0 and later).
Collect metrics for individual processes using the procstat plugin stored in the procstat namespace.
Collect NVIDIA GPU metrics including utilization, memory usage, temperature, and power draw from accelerated EC2 instances.
Default namespace for metrics collected by the agent is CWAgent, although a different namespace can be configured.
Logs collected by the unified agent are processed and stored in CloudWatch Logs.
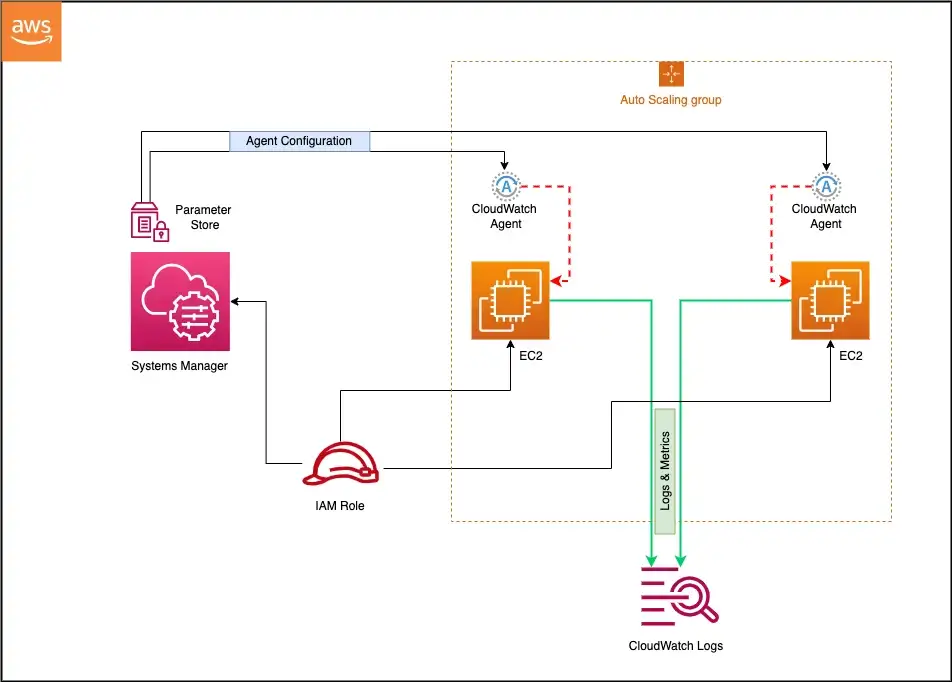
Agent can be installed on Amazon Linux 2, Amazon Linux 2023, and all supported operating systems (Linux, Windows Server, macOS), manually or using AWS Systems Manager.
CloudWatch agent needs permissions to write metrics/logs to CloudWatch and traces to X-Ray. An IAM role for EC2 instances or an IAM user for on-premises servers should be assigned.
AWS provides managed IAM policies for the agent:
CloudWatchAgentServerPolicy – allows the agent to read configuration from SSM Parameter Store and publish metrics, logs, and traces to CloudWatch and X-Ray. Attach to all instances running the agent.
CloudWatchAgentAdminPolicy – includes additional permissions to write agent configuration to SSM Parameter Store. Attach only to the instance used for creating/storing agent configuration.
The older CloudWatch Logs agent (awslogs) is deprecated and no longer supported. Use the unified CloudWatch agent instead.
CloudWatch Agent Configuration
Agent configuration is defined in a JSON file with three main sections:
agent – general configuration such as metrics collection interval, run_as_user, and debug logging.
metrics – specifies which system-level and custom metrics to collect.
logs – specifies which log files or Windows event logs to collect.
traces – configures trace collection using OpenTelemetry Protocol (OTLP) or X-Ray SDK.
Configuration can be created using the agent configuration wizard (amazon-cloudwatch-agent-config-wizard).
Configuration can be stored in AWS Systems Manager Parameter Store for centralized fleet management. Parameter names must start with AmazonCloudWatch-.
Multiple configuration files can be appended together for modular configuration management.
In-Console Agent Management (2025)
CloudWatch provides an in-console experience for automated installation and configuration of the agent on EC2 instances (launched November 2025).
Features include:
Fleet Visibility – view agent status across your entire EC2 fleet.
Automatic Workload Detection – detects running applications and services (NGINX, Tomcat, JVM, Kafka, NVIDIA GPU) and recommends monitoring configurations.
One-Click Installation – deploy the agent to individual instances without manual SSH or SSM commands.
Tag-Based Policies – create automated fleet-wide management policies that apply to new instances, including auto-scaling instances.
Visual Configuration Editor (April 2026) – build agent configurations graphically, selecting metrics, log sources, and deployment targets without hand-editing JSON.
Accessible from the EC2 console → instance detail page → Monitoring tab.
Available in all AWS Commercial Regions at no additional cost (standard CloudWatch pricing applies for collected telemetry).
OpenTelemetry and Traces Support
CloudWatch agent version 1.300025.0+ supports collecting traces from OpenTelemetry SDKs or X-Ray client SDKs.
Supports the OpenTelemetry Protocol (OTLP) for receiving metrics and traces.
Can act as an OTLP collector endpoint, allowing applications instrumented with OpenTelemetry to send telemetry directly to the CloudWatch agent.
Traces are sent to AWS X-Ray for distributed tracing and service map visualization.
Metrics received via OTLP are published to CloudWatch Metrics.
Enables single-agent deployment replacing the need for separate X-Ray daemon and ADOT collector in many scenarios.
CloudWatch Observability Solutions
CloudWatch provides pre-built observability solutions (launched November 2024) that offer workload-specific agent configurations and dashboards.
Available solutions include:
Amazon EC2 Health – system-level metrics and dashboards.
NVIDIA GPU on EC2 – GPU utilization, memory, temperature, and power metrics.
NGINX on EC2 – web server monitoring with traffic analysis.
Apache Tomcat on EC2 – server monitoring with JVM performance metrics.
JVM on EC2 – Java Virtual Machine heap, GC, and thread metrics.
Apache Kafka on EC2 – broker and topic monitoring.
Each solution includes pre-configured agent configuration, recommended metrics, and a curated CloudWatch dashboard.
Solutions are deployed through the in-console agent management experience.
Container Insights Integration
CloudWatch agent is used for Container Insights to collect infrastructure metrics from containerized workloads.
Amazon EKS:
Deployed via the Amazon CloudWatch Observability EKS add-on.
Collects cluster, node, pod, and container-level metrics.
Container Insights with enhanced observability provides additional dimensions and deep container-level visibility.
Supports Windows worker nodes.
Amazon ECS:
Container Insights with enhanced observability for ECS (December 2024) supports EC2 and Fargate launch types.
Auto-collects detailed infrastructure telemetry from cluster level down to container level.
Provides curated dashboards for faster problem isolation.
CloudWatch Application Signals
Application Signals is an APM capability that uses the CloudWatch agent for automatic instrumentation of applications.
Automatically collects metrics and traces without code changes using AWS Distro for OpenTelemetry (ADOT) auto-instrumentation.
Provides key metrics: call volume, availability, latency, faults, and errors.
Supports Java, Python, .NET, and Node.js applications.
Works on EKS (with auto-monitor support since May 2025), ECS, and EC2.
Enables Service Level Objectives (SLOs) for tracking application performance against business goals.
AWS Certification Exam Practice Questions
Questions are collected from Internet and the answers are marked as per my knowledge and understanding (which might differ with yours).
AWS services are updated everyday and both the answers and questions might be outdated soon, so research accordingly.
AWS exam questions are not updated to keep up the pace with AWS updates, so even if the underlying feature has changed the question might not be updated
Open to further feedback, discussion and correction.
A company has a set of servers sitting in AWS and a set of them sitting in their On-premise locations. They want to monitor the system-level metrics for both sets of servers and have a unified dashboard for monitoring. As a system administrator, which of the following can help in this regard?
Install the CloudWatch agent on both sets of servers
Migrate the on-premise servers to AWS to ensure they can be monitored
Setup the metrics dashboard in CloudWatch
Setup the metrics dashboard in AWS Inspector
Setup the metrics dashboard in AWS Config
A Developer has a legacy application that is hosted on-premises. Other applications hosted on AWS depend on the on-premises application for proper functioning. In case of any application errors, the Developer wants to be able to use Amazon CloudWatch to monitor and troubleshoot all applications from one place. How can the Developer accomplish this?
Install an AWS SDK on the on-premises server to automatically send logs to CloudWatch.
Download the CloudWatch agent to the on-premises server. Configure the agent to use IAM user credentials with permissions for CloudWatch.
Upload log files from the on-premises server to Amazon S3 and have CloudWatch read the files.
Upload log files from the on-premises server to an Amazon EC2 instance and have the instance forward the logs to CloudWatch.
A company runs a fleet of EC2 instances hosting Java applications behind an Application Load Balancer. The operations team needs to monitor application-level metrics such as JVM heap usage, garbage collection times, and thread counts in CloudWatch. What is the MOST operationally efficient approach?
Write a custom script to parse JVM metrics and publish them using the PutMetricData API.
Use the CloudWatch agent with the JVM observability solution to automatically collect and visualize JVM metrics.
Install a third-party monitoring agent and export metrics to CloudWatch using metric streams.
Enable detailed monitoring on the EC2 instances to capture JVM metrics.
A DevOps engineer needs to deploy the CloudWatch agent across 200 EC2 instances with consistent configuration. The instances are launched by Auto Scaling groups, and new instances must automatically receive the same monitoring configuration. What approach should the engineer use?
Include the agent installation in the AMI and store the configuration file locally on each instance.
Use a Lambda function triggered by Auto Scaling lifecycle hooks to install and configure the agent.
Store the agent configuration in SSM Parameter Store and use the in-console agent management with tag-based policies for automated fleet-wide deployment.
Create a cron job on each instance to pull the latest configuration from S3 every hour.
A company wants to collect both application traces and system metrics from their EC2 instances using a single agent. They are using OpenTelemetry-instrumented applications. Which CloudWatch agent capability supports this requirement?
Configure the CloudWatch agent with StatsD protocol to receive trace data.
Install both the CloudWatch agent and X-Ray daemon as separate processes.
Configure the CloudWatch agent (version 1.300025.0+) with OTLP support to collect both metrics and traces, sending traces to X-Ray.
Use CloudWatch Embedded Metric Format to combine traces with metric data.
Metrics in different namespaces are isolated from each other, so that metrics from different applications are not mistakenly aggregated into the same statistics.
AWS namespaces all follow the convention AWS/<service>, for e.g. AWS/EC2 and AWS/ELB
Namespace names must be fewer than 256 characters in length.
There is no default namespace. Each data element put into CloudWatch must specify a namespace.
Metrics
Metric is the fundamental concept in CloudWatch.
Uniquely defined by a name, a namespace, and one or more dimensions.
Represents a time-ordered set of data points published to CloudWatch.
Each data point has a time stamp, and (optionally) a unit of measure.
Data points can be either custom metrics or metrics from other services in AWS.
Statistics can be retrieved about those data points as an ordered set of time-series data that occur within a specified time window.
When the statistics are requested, the returned data stream is identified by namespace, metric name, dimension, and (optionally) the unit.
Metrics exist only in the region in which they are created.
CloudWatch stores the metric data for two weeks
Metrics cannot be deleted, but they automatically expire after 15 months, if no new data is published to them.
Metric retention is as follows
Data points with a period of less than 60 seconds are available for 3 hours. These data points are high-resolution custom metrics.
Data points with a 60 secs (1 min) period are available for 15 days
Data points with a 300 secs (5 min) period are available for 63 days
Data points with a 3600 secs (1 hour) period are available for 455 days (15 months)
Dimensions
A dimension is a name/value pair that uniquely identifies a metric.
Every metric has specific characteristics that describe it, and you can think of dimensions as categories for those characteristics.
Dimensions help design a structure for the statistics plan.
Dimensions are part of the unique identifier for a metric, whenever a unique name pair is added to one of the metrics, a new metric is created.
Dimensions can be used to filter result sets that CloudWatch query returns.
A metric can be assigned up to ten dimensions to a metric.
Time Stamps
Each metric data point must be marked with a time stamp to identify the data point on a time series.
Timestamp can be up to two weeks in the past and up to two hours into the future.
If no timestamp is provided, a time stamp based on the time the data element was received is created.
All times reflect the UTC time zone when statistics are retrieved
Resolution
Each metric is one of the following:
Standard resolution, with data having a one-minute granularity
High resolution, with data at a granularity of one second
Units
Units represent the statistic’s unit of measure e.g. count, bytes, %, etc
Statistics
Statistics are metric data aggregations over specified periods of time
Aggregations are made using the namespace, metric name, dimensions, and the data point unit of measure, within the specified time period
Periods
Period is the length of time associated with a specific statistic.
Each statistic represents an aggregation of the metrics data collected for a specified period of time.
Although periods are expressed in seconds, the minimum granularity for a period is one minute.
Aggregation
CloudWatch aggregates statistics according to the period length specified in calls to GetMetricStatistics.
Multiple data points can be published with the same or similar time stamps. CloudWatch aggregates them by period length when the statistics about those data points are requested.
Aggregated statistics are only available when using detailed monitoring.
Instances that use basic monitoring are not included in the aggregates
CloudWatch does not aggregate data across regions.
Alarms
Alarms can automatically initiate actions on behalf of the user, based on specified parameters.
Alarm watches a single metric over a specified time period, and performs one or more actions based on the value of the metric relative to a given threshold over a number of time periods.
Alarms invoke actions for sustained state changes only i.e. the state must have changed and been maintained for a specified number of periods.
Action can be a
SNS notification
Auto Scaling policies
EC2 action – stop or terminate EC2 instances
Lambda function invocation (same or cross-account)
Systems Manager OpsItems or Incident Manager incidents
After an alarm invokes an action due to a change in state, its subsequent behavior depends on the type of action associated with the alarm.
For Auto Scaling policy notifications, the alarm continues to invoke the action for every period that the alarm remains in the new state.
For SNS notifications, no additional actions are invoked.
An alarm has three possible states:
OK—The metric is within the defined threshold
ALARM—The metric is outside of the defined threshold
INSUFFICIENT_DATA—Alarm has just started, the metric is not available, or not enough data is available for the metric to determine the alarm state
Alarms exist only in the region in which they are created.
Alarm actions must reside in the same region as the alarm
Alarm history is available for the last 14 days.
Alarm can be tested by setting it to any state using the SetAlarmState API (mon-set-alarm-state command). This temporary state change lasts only until the next alarm comparison occurs.
Alarms can be disabled and enabled using the DisableAlarmActions and EnableAlarmActions APIs (mon-disable-alarm-actions and mon-enable-alarm-actions commands).
CloudWatch now allows alarming on data up to 7 days old (increased from previous 24-hour limit), with a period of at least 3,600 seconds (1 hour).
Composite Alarms
Composite alarms determine their state by monitoring the states of other alarms.
Rules are defined to combine the status of monitored alarms using Boolean logic (AND, OR, NOT).
Composite alarms help reduce alarm noise by taking actions only at an aggregated level.
A composite alarm’s rule expression can include as many as 100 underlying alarms.
Any single alarm can be included in the rule expressions of as many as 150 composite alarms.
Composite alarms can:
Send Amazon SNS notifications when they change state
Create Systems Manager OpsItems or incidents when they go into ALARM state
Start CloudWatch Investigations for root cause analysis
Composite alarms cannot perform EC2 actions or Auto Scaling actions.
Anomaly Detection
CloudWatch anomaly detection analyzes past metric data and creates a model of expected values.
Alarms can be created based on anomaly detection to alert when metric values are outside the expected band.
The model adjusts for time-of-day patterns, day-of-week patterns, and trends over time.
Useful for metrics without a fixed threshold, such as CPU utilization with seasonal patterns.
Regions
CloudWatch does not aggregate data across regions. Therefore, metrics are completely separate between regions.
CloudWatch Metrics Insights
CloudWatch Metrics Insights is a high-performance SQL-based query engine to query metrics at scale.
Enables identification of trends and patterns across all CloudWatch metrics in real time.
Provides access to up to two weeks of historical data for trend analysis.
Supports functions including AVG, COUNT, MAX, MIN, and SUM.
Can be combined with CloudWatch Alarms to set up dynamic alarms that consistently monitor fast-moving environments.
Supports natural language query generation powered by generative AI – users can ask questions in plain English to generate metric queries.
Custom Metrics
CloudWatch allows publishing custom metrics with put-metric-data CLI command (or its Query API equivalent PutMetricData)
CloudWatch creates a new metric if put-metric-data is called with a new metric name, else it associates the data with the specified existing metric
put-metric-data command can only publish one data point per call
CloudWatch stores data about a metric as a series of data points and each data point has an associated time stamp
Creating a new metric using the put-metric-data command, can take up to two minutes before statistics can be retrieved on the new metric using the get-metric-statistics command and can take up to fifteen minutes before the new metric appears in the list of metrics retrieved using the list-metrics command.
CloudWatch allows publishing
Single data point
Data points can be published with time stamps as granular as one-thousandth of a second, CloudWatch aggregates the data to a minimum granularity of one minute
CloudWatch records the average (sum of all items divided by number of items) of the values received for every 1-minute period, as well as number of samples, maximum value, and minimum value for the same time period
CloudWatch uses one-minute boundaries when aggregating data points
Aggregated set of data points called a statistics set
Data can also be aggregated before being published to CloudWatch
Aggregating data minimizes the number of calls reducing it to a single call per minute with the statistic set of data
Statistics include Sum, Average, Minimum, Maximum, SampleCount
If the application produces data that is more sporadic and have periods that have no associated data, either a the value zero (0) or no value at all can be published
However, it can be helpful to publish zero instead of no value
to monitor the health of your application for e.g. alarm can be configured to notify if no metrics published every 5 minutes
to track the total number of data points
to have statistics such as minimum and average to include data points with the value 0.
CloudWatch Dashboards
CloudWatch dashboards are customizable home pages in the CloudWatch console used to monitor the resources in a single view, even those resources that are spread across different Regions.
Dashboards can be used to create customized views of the metrics and alarms for the AWS resources.
Dashboards can help to create
A single view for selected metrics and alarms to help assess the health of the resources and applications across one or more Regions.
An operational playbook that provides guidance for team members during operational events about how to respond to specific incidents.
A common view of critical resource and application measurements that can be shared by team members for faster communication flow during operational events.
CloudWatch Cross-Account Observability
CloudWatch cross-account observability helps monitor and troubleshoot applications that span multiple accounts within a Region.
Uses Observability Access Manager (OAM) to create and manage links between source and monitoring accounts.
Cross-account observability includes monitoring and source accounts
A monitoring account is a central AWS account that can view and interact with observability data generated from source accounts.
A source account is an individual AWS account that generates observability data for the resources that reside in it.
Source accounts share their observability data with the monitoring account which can include the following types of telemetry:
Metrics in CloudWatch
Log groups in CloudWatch Logs
Traces in AWS X-Ray
Application Signals services and SLOs
Available in all commercial AWS Regions and AWS GovCloud (US) Regions at no extra cost for logs and metrics.
Cross-Account and Cross-Region Log Centralization (2025) allows copying log data from multiple accounts and regions into a single destination account for consolidated analysis.
AWS Console Mobile App (supports interactive alarm graphs, AI log summaries, and natural language log search)
CloudWatch Key Updates (2024-2026)
Unified Data Management (Dec 2025) – CloudWatch provides unified management and analytics for operational, security, and compliance data across AWS and third-party sources.
Organization-wide EC2 Detailed Monitoring (Mar 2026) – Enablement rules automatically enable detailed monitoring for existing and new EC2 instances matching the rule scope.
Natural Language Query Generation (GA June 2024) – Powered by generative AI for both Logs Insights and Metrics Insights, supporting CloudWatch Logs Insights QL, OpenSearch PPL, and OpenSearch SQL.
Integrated Analytics with OpenSearch (Dec 2024) – Supports SQL and PPL query languages for log analytics with JOIN, sub-queries, and SQL functions.
Cross-Region Telemetry Auditing (Apr 2026) – Enable telemetry auditing for account/organization across all regions with enablement rules.
Lambda Tiered Pricing for Logs (May 2025) – Reduces Lambda CloudWatch logging costs with tiered pricing and additional logging destinations.
AWS Certification Exam Practice Questions
Questions are collected from Internet and the answers are marked as per my knowledge and understanding (which might differ with yours).
AWS services are updated everyday and both the answers and questions might be outdated soon, so research accordingly.
AWS exam questions are not updated to keep up the pace with AWS updates, so even if the underlying feature has changed the question might not be updated
Open to further feedback, discussion and correction.
A company needs to monitor the read and write IOPs metrics for their AWS MySQL RDS instance and send real-time alerts to their operations team. Which AWS services can accomplish this? Choose 2 answers
Amazon Simple Email Service (Cannot be integrated with CloudWatch directly)
Amazon CloudWatch
Amazon Simple Queue Service
Amazon Route 53
Amazon Simple Notification Service
A customer needs to capture all client connection information from their load balancer every five minutes. The company wants to use this data for analyzing traffic patterns and troubleshooting their applications. Which of the following options meets the customer requirements?
Enable AWS CloudTrail for the load balancer.
Enable access logs on the load balancer. (Refer link)
Install the Amazon CloudWatch Logs agent on the load balancer.
Enable Amazon CloudWatch metrics on the load balancer (does not provide Client connection information)
A user is running a batch process on EBS backed EC2 instances. The batch process starts a few instances to process Hadoop Map reduce jobs, which can run between 50 – 600 minutes or sometimes for more time. The user wants to configure that the instance gets terminated only when the process is completed. How can the user configure this with CloudWatch?
Setup the CloudWatch action to terminate the instance when the CPU utilization is less than 5%
Setup the CloudWatch with Auto Scaling to terminate all the instances
Setup a job which terminates all instances after 600 minutes
It is not possible to terminate instances automatically
A user has two EC2 instances running in two separate regions. The user is running an internal memory management tool, which captures the data and sends it to CloudWatch in US East, using a CLI with the same namespace and metric. Which of the below mentioned options is true with respect to the above statement?
The setup will not work as CloudWatch cannot receive data across regions
CloudWatch will receive and aggregate the data based on the namespace and metric
CloudWatch will give an error since the data will conflict due to two sources
CloudWatch will take the data of the server, which sends the data first
A user is sending the data to CloudWatch using the CloudWatch API. The user is sending data 90 minutes in the future. What will CloudWatch do in this case?
CloudWatch will accept the data
It is not possible to send data of the future
It is not possible to send the data manually to CloudWatch
The user cannot send data for more than 60 minutes in the future
A user is having data generated randomly based on a certain event. The user wants to upload that data to CloudWatch. It may happen that event may not have data generated for some period due to randomness. Which of the below mentioned options is a recommended option for this case?
For the period when there is no data, the user should not send the data at all
For the period when there is no data the user should send a blank value
For the period when there is no data the user should send the value as 0 (Refer User Guide)
The user must upload the data to CloudWatch as having no data for some period will cause an error at CloudWatch monitoring
A user has a weighing plant. The user measures the weight of some goods every 5 minutes and sends data to AWS CloudWatch for monitoring and tracking. Which of the below mentioned parameters is mandatory for the user to include in the request list?
A user has a refrigerator plant. The user is measuring the temperature of the plant every 15 minutes. If the user wants to send the data to CloudWatch to view the data visually, which of the below mentioned statements is true with respect to the information given above?
The user needs to use AWS CLI or API to upload the data
The user can use the AWS Import Export facility to import data to CloudWatch
The user will upload data from the AWS console
The user cannot upload data to CloudWatch since it is not an AWS service metric
A user has launched an EC2 instance. The user is planning to setup the CloudWatch alarm. Which of the below mentioned actions is not supported by the CloudWatch alarm?
Notify the Auto Scaling launch config to scale up
Send an SMS using SNS
Notify the Auto Scaling group to scale down
Stop the EC2 instance
A user has a refrigerator plant. The user is measuring the temperature of the plant every 15 minutes. If the user wants to send the data to CloudWatch to view the data visually, which of the below mentioned statements is true with respect to the information given above?
The user needs to use AWS CLI or API to upload the data
The user can use the AWS Import Export facility to import data to CloudWatch
The user will upload data from the AWS console
The user cannot upload data to CloudWatch since it is not an AWS service metric
A user is trying to aggregate all the CloudWatch metric data of the last 1 week. Which of the below mentioned statistics is not available for the user as a part of data aggregation?
Aggregate
Sum
Sample data
Average
A user has setup a CloudWatch alarm on an EC2 action when the CPU utilization is above 75%. The alarm sends a notification to SNS on the alarm state. If the user wants to simulate the alarm action how can he achieve this?
Run activities on the CPU such that its utilization reaches above 75%
From the AWS console change the state to ‘Alarm’
The user can set the alarm state to ‘Alarm’ using CLI
Run the SNS action manually
A user is publishing custom metrics to CloudWatch. Which of the below mentioned statements will help the user understand the functionality better?
The user can use the CloudWatch Import tool
The user should be able to see the data in the console after around 15 minutes
If the user is uploading the custom data, the user must supply the namespace, timezone, and metric name as part of the command
The user can view as well as upload data using the console, CLI and APIs
An application that you are managing has EC2 instances and DynamoDB tables deployed to several AWS Regions. In order to monitor the performance of the application globally, you would like to see two graphs 1) Avg CPU Utilization across all EC2 instances and 2) Number of Throttled Requests for all DynamoDB tables. How can you accomplish this? [PROFESSIONAL]
Tag your resources with the application name, and select the tag name as the dimension in the CloudWatch Management console to view the respective graphs (CloudWatch metrics are regional)
Use the CloudWatch CLI tools to pull the respective metrics from each regional endpoint. Aggregate the data offline & store it for graphing in CloudWatch. (Note: CloudWatch cross-account cross-region dashboards and log centralization are now available but this question tests the concept that metrics are regional)
Add SNMP traps to each instance and DynamoDB table. Leverage a central monitoring server to capture data from each instance and table. Put the aggregate data into CloudWatch for graphing (Can’t add SNMP traps to DynamoDB as it is a managed service)
Add a CloudWatch agent to each instance and attach one to each DynamoDB table. When configuring the agent set the appropriate application name & view the graphs in CloudWatch. (Can’t add agents to DynamoDB as it is a managed service)
You have set up Individual AWS accounts for each project. You have been asked to make sure your AWS Infrastructure costs do not exceed the budget set per project for each month. Which of the following approaches can help ensure that you do not exceed the budget each month? [PROFESSIONAL]
Consolidate your accounts so you have a single bill for all accounts and projects (Consolidation will not help limit per account)
Set up auto scaling with CloudWatch alarms using SNS to notify you when you are running too many Instances in a given account (many instances do not directly map to cost and would not give exact cost)
Set up CloudWatch billing alerts for all AWS resources used by each project, with a notification occurring when the amount for each resource tagged to a particular project matches the budget allocated to the project. (as each project already has a account, no need for resource tagging)
Set up CloudWatch billing alerts for all AWS resources used by each account, with email notifications when it hits 50%. 80% and 90% of its budgeted monthly spend
You meet once per month with your operations team to review the past month’s data. During the meeting, you realize that 3 weeks ago, your monitoring system which pings over HTTP from outside AWS recorded a large spike in latency on your 3-tier web service API. You use DynamoDB for the database layer, ELB, EBS, and EC2 for the business logic tier, and SQS, ELB, and EC2 for the presentation layer. Which of the following techniques will NOT help you figure out what happened?
Check your CloudTrail log history around the spike’s time for any API calls that caused slowness.
Review CloudWatch Metrics graphs to determine which component(s) slowed the system down. (Note: CloudWatch metric data is retained for 15 months. Data at 1-min resolution is available for 15 days, 5-min for 63 days, and 1-hour for 455 days. The 3-week old data would still be available at 5-min or 1-hour resolution.)
Review your ELB access logs in S3 to see if any ELBs in your system saw the latency.
Analyze your logs to detect bursts in traffic at that time.
You have a high security requirement for your AWS accounts. What is the most rapid and sophisticated setup you can use to react to AWS API calls to your account?
Subscription to AWS Config via an SNS Topic. Use a Lambda Function to perform in-flight analysis and reactivity to changes as they occur.
Global AWS CloudTrail setup delivering to S3 with an SNS subscription to the deliver notifications, pushing into a Lambda, which inserts records into an ELK stack for analysis.
Use a CloudWatch Rule ScheduleExpression to periodically analyze IAM credential logs. Push the deltas for events into an ELK stack and perform ad-hoc analysis there.
Amazon EventBridge Rules (formerly CloudWatch Events Rules), which trigger based on all AWS API calls, submitting all events to an AWS Kinesis Stream for arbitrary downstream analysis. (EventBridge (evolution of CloudWatch Events) allows subscription to AWS API calls, and direction of these events into Kinesis Streams. This allows a unified, near real-time stream for all API calls. Referlink)
To monitor API calls against our AWS account by different users and entities, we can use ____ to create a history of calls in bulk for later review, and use ____ for reacting to AWS API calls in real-time.
AWS Config; AWS Inspector
AWS CloudTrail; AWS Config
AWS CloudTrail; Amazon EventBridge (formerly CloudWatch Events) (CloudTrail is a batch API call collection service, EventBridge enables real-time monitoring of calls through the Rules object interface. Referlink)
AWS Config; AWS Lambda
You are hired as the new head of operations for a SaaS company. Your CTO has asked you to make debugging any part of your entire operation simpler and as fast as possible. She complains that she has no idea what is going on in the complex, service-oriented architecture, because the developers just log to disk, and it’s very hard to find errors in logs on so many services. How can you best meet this requirement and satisfy your CTO? [PROFESSIONAL]
Copy all log files into AWS S3 using a cron job on each instance. Use an S3 Notification Configuration on the <code>PutBucket</code> event and publish events to AWS Lambda. Use the Lambda to analyze logs as soon as they come in and flag issues. (is not fast in search and introduces delay)
Begin using CloudWatch Logs on every service. Stream all Log Groups into S3 objects. Use AWS EMR cluster jobs to perform adhoc MapReduce analysis and write new queries when needed. (is not fast in search and introduces delay)
Copy all log files into AWS S3 using a cron job on each instance. Use an S3 Notification Configuration on the <code>PutBucket</code> event and publish events to AWS Kinesis. Use Apache Spark on AWS EMR to perform at-scale stream processing queries on the log chunks and flag issues. (is not fast in search and introduces delay)
Begin using CloudWatch Logs on every service. Stream all Log Groups into an Amazon OpenSearch Service Domain running Kibana and perform log analysis on a search cluster. (OpenSearch (formerly Elasticsearch) with Kibana/OpenSearch Dashboards is designed for real-time, ad-hoc log analysis and aggregation. Note: CloudWatch now also offers integrated analytics with OpenSearch Service directly.)
Your EC2-Based Multi-tier application includes a monitoring instance that periodically makes application-level read only requests of various application components and if any of those fail more than three times 30 seconds calls CloudWatch to fire an alarm, and the alarm notifies your operations team by email and SMS of a possible application health problem. However, you also need to watch the watcher -the monitoring instance itself – and be notified if it becomes unhealthy. Which of the following is a simple way to achieve that goal? [PROFESSIONAL]
Run another monitoring instance that pings the monitoring instance and fires a CloudWatch alarm that notifies your operations team should the primary monitoring instance become unhealthy.
Set a CloudWatch alarm based on EC2 system and instance status checks and have the alarm notify your operations team of any detected problem with the monitoring instance.
Set a CloudWatch alarm based on the CPU utilization of the monitoring instance and have the alarm notify your operations team if the CPU usage exceeds 50% for more than one minute: then have your monitoring application go into a CPU-bound loop should it detect any application problems.
Have the monitoring instances post messages to an SQS queue and then dequeue those messages on another instance should the queue cease to have new messages, the second instance should first terminate the original monitoring instance start another backup monitoring instance and assume the role of the previous monitoring instance and beginning adding messages to the SQS queue.
A company wants to reduce alarm noise in their monitoring system. They have multiple alarms for different components of a web application. Which CloudWatch feature should they use to consolidate multiple alarms into a single notification?
CloudWatch Metrics Insights
CloudWatch Composite Alarms (Composite alarms combine multiple alarm states using Boolean logic to reduce noise and send notifications only at an aggregated level)
CloudWatch Anomaly Detection
CloudWatch Dashboards
A DevOps team wants to automatically identify root causes when CloudWatch alarms fire, correlating metrics, logs, and deployment events without manual investigation. Which CloudWatch feature should they use?
CloudWatch Logs Insights
CloudWatch Contributor Insights
CloudWatch Investigations (Powered by Amazon Q Developer, Investigations uses AI to analyze multiple telemetry sources and suggest root causes and remediation steps)
CloudWatch Application Signals
An organization wants to send application metrics to CloudWatch using open standards without vendor-specific conversion logic. They need support for high-cardinality metrics with many labels. Which approach should they use?
Use CloudWatch PutMetricData API with custom metrics
Use CloudWatch Metric Streams to export to a third-party tool
Send metrics directly using the OpenTelemetry Protocol (OTLP) to CloudWatch’s native OTel endpoint (CloudWatch supports native OTLP metrics ingestion with up to 150 labels per metric, queryable via PromQL)
Use the CloudWatch Agent with StatsD protocol
A company wants to ingest, transform, and route log data from multiple sources to CloudWatch without managing any infrastructure. They need to parse complex log formats and enrich the data during ingestion. Which service should they use?
CloudWatch Logs Subscription Filters
Amazon Kinesis Data Firehose
CloudWatch Pipelines (CloudWatch Pipelines is a fully managed service that ingests, transforms, and routes log data with support for parsing, conditional processing, and AI-assisted processor configuration)
CloudWatch Log Transformers only
A team needs to monitor their application’s availability, latency, and error rate with pre-built dashboards and set up Service Level Objectives (SLOs) without building custom monitoring. Which CloudWatch capability provides this?
CloudWatch Synthetics
CloudWatch Container Insights
CloudWatch Internet Monitor
CloudWatch Application Signals (Application Signals provides automatic instrumentation, pre-built APM dashboards with golden metrics, and SLO tracking without custom setup)
Amazon CloudWatch
CloudWatch monitors AWS resources and applications in real time.
CloudWatch can be used to collect and track metrics, which are the variables to be measured for resources and applications.
CloudWatch is basically a metrics repository where the metrics can be inserted and statistics retrieved based on those metrics.
In addition to monitoring the built-in metrics that come with AWS, custom metrics can also be monitored
CloudWatch provides system-wide visibility into resource utilization, application performance, and operational health.
By default, CloudWatch stores the log data indefinitely, and the retention can be changed for each log group at any time.
CloudWatch alarms can be configured
to send notifications or
to automatically make changes to the resources based on defined rules
CloudWatch dashboards are customizable home pages in the CloudWatch console used to monitor the resources in a single view, even those resources that are spread across different Regions.
CloudWatch Agent helps collect metrics and logs from EC2 instances and on-premises servers and push them to CloudWatch.
CloudWatch now supports native OpenTelemetry (OTel) metrics, enabling metrics to be sent directly using the OpenTelemetry Protocol (OTLP) without custom conversion logic.
CloudWatch supports PromQL (Prometheus Query Language) for querying metrics including OTel-ingested and AWS vended metrics.
CloudWatch Investigations uses AI-powered root cause analysis to help identify anomalies, surface related signals, and suggest remediation steps.
CloudWatch Architecture
CloudWatch collects various metrics from various resources
These metrics, as statistics, are available to the user through Console, CLI
CloudWatch allows the creation of alarms with defined rules
to perform actions to auto-scaling or stop, start, or terminate instances
to send notifications using SNS actions on your behalf
CloudWatch Concepts
Namespaces
CloudWatch namespaces are containers for metrics.
Metrics in different namespaces are isolated from each other, so that metrics from different applications are not mistakenly aggregated into the same statistics.
AWS namespaces all follow the convention AWS/<service>, for e.g. AWS/EC2 and AWS/ELB
Namespace names must be fewer than 256 characters in length.
There is no default namespace. Each data element put into CloudWatch must specify a namespace.
Metrics
Metric is the fundamental concept in CloudWatch.
Uniquely defined by a name, a namespace, and one or more dimensions.
Represents a time-ordered set of data points published to CloudWatch.
Each data point has a time stamp, and (optionally) a unit of measure.
Data points can be either custom metrics or metrics from other services in AWS.
Statistics can be retrieved about those data points as an ordered set of time-series data that occur within a specified time window.
When the statistics are requested, the returned data stream is identified by namespace, metric name, dimension, and (optionally) the unit.
Metrics exist only in the region in which they are created.
CloudWatch stores the metric data for two weeks
Metrics cannot be deleted, but they automatically expire after 15 months, if no new data is published to them.
Metric retention is as follows
Data points with a period of less than 60 seconds are available for 3 hours. These data points are high-resolution custom metrics.
Data points with a 60 secs (1 min) period are available for 15 days
Data points with a 300 secs (5 min) period are available for 63 days
Data points with a 3600 secs (1 hour) period are available for 455 days (15 months)
Dimensions
A dimension is a name/value pair that uniquely identifies a metric.
Every metric has specific characteristics that describe it, and you can think of dimensions as categories for those characteristics.
Dimensions help design a structure for the statistics plan.
Dimensions are part of the unique identifier for a metric, whenever a unique name pair is added to one of the metrics, a new metric is created.
Dimensions can be used to filter result sets that CloudWatch query returns.
A metric can be assigned up to ten dimensions to a metric.
Time Stamps
Each metric data point must be marked with a time stamp to identify the data point on a time series.
Timestamp can be up to two weeks in the past and up to two hours into the future.
If no timestamp is provided, a time stamp based on the time the data element was received is created.
All times reflect the UTC time zone when statistics are retrieved
Resolution
Each metric is one of the following:
Standard resolution, with data having a one-minute granularity
High resolution, with data at a granularity of one second
Units
Units represent the statistic’s unit of measure e.g. count, bytes, %, etc
Statistics
Statistics are metric data aggregations over specified periods of time
Aggregations are made using the namespace, metric name, dimensions, and the data point unit of measure, within the specified time period
Periods
Period is the length of time associated with a specific statistic.
Each statistic represents an aggregation of the metrics data collected for a specified period of time.
Although periods are expressed in seconds, the minimum granularity for a period is one minute.
Aggregation
CloudWatch aggregates statistics according to the period length specified in calls to GetMetricStatistics.
Multiple data points can be published with the same or similar time stamps. CloudWatch aggregates them by period length when the statistics about those data points are requested.
Aggregated statistics are only available when using detailed monitoring.
Instances that use basic monitoring are not included in the aggregates
CloudWatch does not aggregate data across regions.
Alarms
Alarms can automatically initiate actions on behalf of the user, based on specified parameters.
Alarm watches a single metric over a specified time period, and performs one or more actions based on the value of the metric relative to a given threshold over a number of time periods.
Alarms invoke actions for sustained state changes only i.e. the state must have changed and been maintained for a specified number of periods.
Action can be a
SNS notification
Auto Scaling policies
EC2 action – stop or terminate EC2 instances
Lambda function invocation (same or cross-account)
Systems Manager OpsItems or Incident Manager incidents
After an alarm invokes an action due to a change in state, its subsequent behavior depends on the type of action associated with the alarm.
For Auto Scaling policy notifications, the alarm continues to invoke the action for every period that the alarm remains in the new state.
For SNS notifications, no additional actions are invoked.
An alarm has three possible states:
OK—The metric is within the defined threshold
ALARM—The metric is outside of the defined threshold
INSUFFICIENT_DATA—Alarm has just started, the metric is not available, or not enough data is available for the metric to determine the alarm state
Alarms exist only in the region in which they are created.
Alarm actions must reside in the same region as the alarm
Alarm history is available for the last 14 days.
Alarm can be tested by setting it to any state using the SetAlarmState API (mon-set-alarm-state command). This temporary state change lasts only until the next alarm comparison occurs.
Alarms can be disabled and enabled using the DisableAlarmActions and EnableAlarmActions APIs (mon-disable-alarm-actions and mon-enable-alarm-actions commands).
CloudWatch now allows alarming on data up to 7 days old (increased from previous 24-hour limit), with a period of at least 3,600 seconds (1 hour).
Composite Alarms
Composite alarms determine their state by monitoring the states of other alarms.
Rules are defined to combine the status of monitored alarms using Boolean logic (AND, OR, NOT).
Composite alarms help reduce alarm noise by taking actions only at an aggregated level.
A composite alarm’s rule expression can include as many as 100 underlying alarms.
Any single alarm can be included in the rule expressions of as many as 150 composite alarms.
Composite alarms can:
Send Amazon SNS notifications when they change state
Create Systems Manager OpsItems or incidents when they go into ALARM state
Start CloudWatch Investigations for root cause analysis
Composite alarms cannot perform EC2 actions or Auto Scaling actions.
Anomaly Detection
CloudWatch anomaly detection analyzes past metric data and creates a model of expected values.
Alarms can be created based on anomaly detection to alert when metric values are outside the expected band.
The model adjusts for time-of-day patterns, day-of-week patterns, and trends over time.
Useful for metrics without a fixed threshold, such as CPU utilization with seasonal patterns.
Regions
CloudWatch does not aggregate data across regions. Therefore, metrics are completely separate between regions.
CloudWatch Metrics Insights
CloudWatch Metrics Insights is a high-performance SQL-based query engine to query metrics at scale.
Enables identification of trends and patterns across all CloudWatch metrics in real time.
Provides access to up to two weeks of historical data for trend analysis.
Supports functions including AVG, COUNT, MAX, MIN, and SUM.
Can be combined with CloudWatch Alarms to set up dynamic alarms that consistently monitor fast-moving environments.
Supports natural language query generation powered by generative AI – users can ask questions in plain English to generate metric queries.
Custom Metrics
CloudWatch allows publishing custom metrics with put-metric-data CLI command (or its Query API equivalent PutMetricData)
CloudWatch creates a new metric if put-metric-data is called with a new metric name, else it associates the data with the specified existing metric
put-metric-data command can only publish one data point per call
CloudWatch stores data about a metric as a series of data points and each data point has an associated time stamp
Creating a new metric using the put-metric-data command, can take up to two minutes before statistics can be retrieved on the new metric using the get-metric-statistics command and can take up to fifteen minutes before the new metric appears in the list of metrics retrieved using the list-metrics command.
CloudWatch allows publishing
Single data point
Data points can be published with time stamps as granular as one-thousandth of a second, CloudWatch aggregates the data to a minimum granularity of one minute
CloudWatch records the average (sum of all items divided by number of items) of the values received for every 1-minute period, as well as number of samples, maximum value, and minimum value for the same time period
CloudWatch uses one-minute boundaries when aggregating data points
Aggregated set of data points called a statistics set
Data can also be aggregated before being published to CloudWatch
Aggregating data minimizes the number of calls reducing it to a single call per minute with the statistic set of data
Statistics include Sum, Average, Minimum, Maximum, SampleCount
If the application produces data that is more sporadic and have periods that have no associated data, either a the value zero (0) or no value at all can be published
However, it can be helpful to publish zero instead of no value
to monitor the health of your application for e.g. alarm can be configured to notify if no metrics published every 5 minutes
to track the total number of data points
to have statistics such as minimum and average to include data points with the value 0.
CloudWatch Dashboards
CloudWatch dashboards are customizable home pages in the CloudWatch console used to monitor the resources in a single view, even those resources that are spread across different Regions.
Dashboards can be used to create customized views of the metrics and alarms for the AWS resources.
Dashboards can help to create
A single view for selected metrics and alarms to help assess the health of the resources and applications across one or more Regions.
An operational playbook that provides guidance for team members during operational events about how to respond to specific incidents.
A common view of critical resource and application measurements that can be shared by team members for faster communication flow during operational events.
CloudWatch Cross-Account Observability
CloudWatch cross-account observability helps monitor and troubleshoot applications that span multiple accounts within a Region.
Uses Observability Access Manager (OAM) to create and manage links between source and monitoring accounts.
Cross-account observability includes monitoring and source accounts
A monitoring account is a central AWS account that can view and interact with observability data generated from source accounts.
A source account is an individual AWS account that generates observability data for the resources that reside in it.
Source accounts share their observability data with the monitoring account which can include the following types of telemetry:
Metrics in CloudWatch
Log groups in CloudWatch Logs
Traces in AWS X-Ray
Application Signals services and SLOs
Available in all commercial AWS Regions and AWS GovCloud (US) Regions at no extra cost for logs and metrics.
Cross-Account and Cross-Region Log Centralization (2025) allows copying log data from multiple accounts and regions into a single destination account for consolidated analysis.
AWS Console Mobile App (supports interactive alarm graphs, AI log summaries, and natural language log search)
CloudWatch Key Updates (2024-2026)
Unified Data Management (Dec 2025) – CloudWatch provides unified management and analytics for operational, security, and compliance data across AWS and third-party sources.
Organization-wide EC2 Detailed Monitoring (Mar 2026) – Enablement rules automatically enable detailed monitoring for existing and new EC2 instances matching the rule scope.
Natural Language Query Generation (GA June 2024) – Powered by generative AI for both Logs Insights and Metrics Insights, supporting CloudWatch Logs Insights QL, OpenSearch PPL, and OpenSearch SQL.
Integrated Analytics with OpenSearch (Dec 2024) – Supports SQL and PPL query languages for log analytics with JOIN, sub-queries, and SQL functions.
Cross-Region Telemetry Auditing (Apr 2026) – Enable telemetry auditing for account/organization across all regions with enablement rules.
Lambda Tiered Pricing for Logs (May 2025) – Reduces Lambda CloudWatch logging costs with tiered pricing and additional logging destinations.
AWS Certification Exam Practice Questions
Questions are collected from Internet and the answers are marked as per my knowledge and understanding (which might differ with yours).
AWS services are updated everyday and both the answers and questions might be outdated soon, so research accordingly.
AWS exam questions are not updated to keep up the pace with AWS updates, so even if the underlying feature has changed the question might not be updated
Open to further feedback, discussion and correction.
A company needs to monitor the read and write IOPs metrics for their AWS MySQL RDS instance and send real-time alerts to their operations team. Which AWS services can accomplish this? Choose 2 answers
Amazon Simple Email Service (Cannot be integrated with CloudWatch directly)
Amazon CloudWatch
Amazon Simple Queue Service
Amazon Route 53
Amazon Simple Notification Service
A customer needs to capture all client connection information from their load balancer every five minutes. The company wants to use this data for analyzing traffic patterns and troubleshooting their applications. Which of the following options meets the customer requirements?
Enable AWS CloudTrail for the load balancer.
Enable access logs on the load balancer. (Refer link)
Install the Amazon CloudWatch Logs agent on the load balancer.
Enable Amazon CloudWatch metrics on the load balancer (does not provide Client connection information)
A user is running a batch process on EBS backed EC2 instances. The batch process starts a few instances to process Hadoop Map reduce jobs, which can run between 50 – 600 minutes or sometimes for more time. The user wants to configure that the instance gets terminated only when the process is completed. How can the user configure this with CloudWatch?
Setup the CloudWatch action to terminate the instance when the CPU utilization is less than 5%
Setup the CloudWatch with Auto Scaling to terminate all the instances
Setup a job which terminates all instances after 600 minutes
It is not possible to terminate instances automatically
A user has two EC2 instances running in two separate regions. The user is running an internal memory management tool, which captures the data and sends it to CloudWatch in US East, using a CLI with the same namespace and metric. Which of the below mentioned options is true with respect to the above statement?
The setup will not work as CloudWatch cannot receive data across regions
CloudWatch will receive and aggregate the data based on the namespace and metric
CloudWatch will give an error since the data will conflict due to two sources
CloudWatch will take the data of the server, which sends the data first
A user is sending the data to CloudWatch using the CloudWatch API. The user is sending data 90 minutes in the future. What will CloudWatch do in this case?
CloudWatch will accept the data
It is not possible to send data of the future
It is not possible to send the data manually to CloudWatch
The user cannot send data for more than 60 minutes in the future
A user is having data generated randomly based on a certain event. The user wants to upload that data to CloudWatch. It may happen that event may not have data generated for some period due to randomness. Which of the below mentioned options is a recommended option for this case?
For the period when there is no data, the user should not send the data at all
For the period when there is no data the user should send a blank value
For the period when there is no data the user should send the value as 0 (Refer User Guide)
The user must upload the data to CloudWatch as having no data for some period will cause an error at CloudWatch monitoring
A user has a weighing plant. The user measures the weight of some goods every 5 minutes and sends data to AWS CloudWatch for monitoring and tracking. Which of the below mentioned parameters is mandatory for the user to include in the request list?
A user has a refrigerator plant. The user is measuring the temperature of the plant every 15 minutes. If the user wants to send the data to CloudWatch to view the data visually, which of the below mentioned statements is true with respect to the information given above?
The user needs to use AWS CLI or API to upload the data
The user can use the AWS Import Export facility to import data to CloudWatch
The user will upload data from the AWS console
The user cannot upload data to CloudWatch since it is not an AWS service metric
A user has launched an EC2 instance. The user is planning to setup the CloudWatch alarm. Which of the below mentioned actions is not supported by the CloudWatch alarm?
Notify the Auto Scaling launch config to scale up
Send an SMS using SNS
Notify the Auto Scaling group to scale down
Stop the EC2 instance
A user has a refrigerator plant. The user is measuring the temperature of the plant every 15 minutes. If the user wants to send the data to CloudWatch to view the data visually, which of the below mentioned statements is true with respect to the information given above?
The user needs to use AWS CLI or API to upload the data
The user can use the AWS Import Export facility to import data to CloudWatch
The user will upload data from the AWS console
The user cannot upload data to CloudWatch since it is not an AWS service metric
A user is trying to aggregate all the CloudWatch metric data of the last 1 week. Which of the below mentioned statistics is not available for the user as a part of data aggregation?
Aggregate
Sum
Sample data
Average
A user has setup a CloudWatch alarm on an EC2 action when the CPU utilization is above 75%. The alarm sends a notification to SNS on the alarm state. If the user wants to simulate the alarm action how can he achieve this?
Run activities on the CPU such that its utilization reaches above 75%
From the AWS console change the state to ‘Alarm’
The user can set the alarm state to ‘Alarm’ using CLI
Run the SNS action manually
A user is publishing custom metrics to CloudWatch. Which of the below mentioned statements will help the user understand the functionality better?
The user can use the CloudWatch Import tool
The user should be able to see the data in the console after around 15 minutes
If the user is uploading the custom data, the user must supply the namespace, timezone, and metric name as part of the command
The user can view as well as upload data using the console, CLI and APIs
An application that you are managing has EC2 instances and DynamoDB tables deployed to several AWS Regions. In order to monitor the performance of the application globally, you would like to see two graphs 1) Avg CPU Utilization across all EC2 instances and 2) Number of Throttled Requests for all DynamoDB tables. How can you accomplish this? [PROFESSIONAL]
Tag your resources with the application name, and select the tag name as the dimension in the CloudWatch Management console to view the respective graphs (CloudWatch metrics are regional)
Use the CloudWatch CLI tools to pull the respective metrics from each regional endpoint. Aggregate the data offline & store it for graphing in CloudWatch. (Note: CloudWatch cross-account cross-region dashboards and log centralization are now available but this question tests the concept that metrics are regional)
Add SNMP traps to each instance and DynamoDB table. Leverage a central monitoring server to capture data from each instance and table. Put the aggregate data into CloudWatch for graphing (Can’t add SNMP traps to DynamoDB as it is a managed service)
Add a CloudWatch agent to each instance and attach one to each DynamoDB table. When configuring the agent set the appropriate application name & view the graphs in CloudWatch. (Can’t add agents to DynamoDB as it is a managed service)
You have set up Individual AWS accounts for each project. You have been asked to make sure your AWS Infrastructure costs do not exceed the budget set per project for each month. Which of the following approaches can help ensure that you do not exceed the budget each month? [PROFESSIONAL]
Consolidate your accounts so you have a single bill for all accounts and projects (Consolidation will not help limit per account)
Set up auto scaling with CloudWatch alarms using SNS to notify you when you are running too many Instances in a given account (many instances do not directly map to cost and would not give exact cost)
Set up CloudWatch billing alerts for all AWS resources used by each project, with a notification occurring when the amount for each resource tagged to a particular project matches the budget allocated to the project. (as each project already has a account, no need for resource tagging)
Set up CloudWatch billing alerts for all AWS resources used by each account, with email notifications when it hits 50%. 80% and 90% of its budgeted monthly spend
You meet once per month with your operations team to review the past month’s data. During the meeting, you realize that 3 weeks ago, your monitoring system which pings over HTTP from outside AWS recorded a large spike in latency on your 3-tier web service API. You use DynamoDB for the database layer, ELB, EBS, and EC2 for the business logic tier, and SQS, ELB, and EC2 for the presentation layer. Which of the following techniques will NOT help you figure out what happened?
Check your CloudTrail log history around the spike’s time for any API calls that caused slowness.
Review CloudWatch Metrics graphs to determine which component(s) slowed the system down. (Note: CloudWatch metric data is retained for 15 months. Data at 1-min resolution is available for 15 days, 5-min for 63 days, and 1-hour for 455 days. The 3-week old data would still be available at 5-min or 1-hour resolution.)
Review your ELB access logs in S3 to see if any ELBs in your system saw the latency.
Analyze your logs to detect bursts in traffic at that time.
You have a high security requirement for your AWS accounts. What is the most rapid and sophisticated setup you can use to react to AWS API calls to your account?
Subscription to AWS Config via an SNS Topic. Use a Lambda Function to perform in-flight analysis and reactivity to changes as they occur.
Global AWS CloudTrail setup delivering to S3 with an SNS subscription to the deliver notifications, pushing into a Lambda, which inserts records into an ELK stack for analysis.
Use a CloudWatch Rule ScheduleExpression to periodically analyze IAM credential logs. Push the deltas for events into an ELK stack and perform ad-hoc analysis there.
Amazon EventBridge Rules (formerly CloudWatch Events Rules), which trigger based on all AWS API calls, submitting all events to an AWS Kinesis Stream for arbitrary downstream analysis. (EventBridge (evolution of CloudWatch Events) allows subscription to AWS API calls, and direction of these events into Kinesis Streams. This allows a unified, near real-time stream for all API calls. Referlink)
To monitor API calls against our AWS account by different users and entities, we can use ____ to create a history of calls in bulk for later review, and use ____ for reacting to AWS API calls in real-time.
AWS Config; AWS Inspector
AWS CloudTrail; AWS Config
AWS CloudTrail; Amazon EventBridge (formerly CloudWatch Events) (CloudTrail is a batch API call collection service, EventBridge enables real-time monitoring of calls through the Rules object interface. Referlink)
AWS Config; AWS Lambda
You are hired as the new head of operations for a SaaS company. Your CTO has asked you to make debugging any part of your entire operation simpler and as fast as possible. She complains that she has no idea what is going on in the complex, service-oriented architecture, because the developers just log to disk, and it’s very hard to find errors in logs on so many services. How can you best meet this requirement and satisfy your CTO? [PROFESSIONAL]
Copy all log files into AWS S3 using a cron job on each instance. Use an S3 Notification Configuration on the <code>PutBucket</code> event and publish events to AWS Lambda. Use the Lambda to analyze logs as soon as they come in and flag issues. (is not fast in search and introduces delay)
Begin using CloudWatch Logs on every service. Stream all Log Groups into S3 objects. Use AWS EMR cluster jobs to perform adhoc MapReduce analysis and write new queries when needed. (is not fast in search and introduces delay)
Copy all log files into AWS S3 using a cron job on each instance. Use an S3 Notification Configuration on the <code>PutBucket</code> event and publish events to AWS Kinesis. Use Apache Spark on AWS EMR to perform at-scale stream processing queries on the log chunks and flag issues. (is not fast in search and introduces delay)
Begin using CloudWatch Logs on every service. Stream all Log Groups into an Amazon OpenSearch Service Domain running Kibana and perform log analysis on a search cluster. (OpenSearch (formerly Elasticsearch) with Kibana/OpenSearch Dashboards is designed for real-time, ad-hoc log analysis and aggregation. Note: CloudWatch now also offers integrated analytics with OpenSearch Service directly.)
Your EC2-Based Multi-tier application includes a monitoring instance that periodically makes application-level read only requests of various application components and if any of those fail more than three times 30 seconds calls CloudWatch to fire an alarm, and the alarm notifies your operations team by email and SMS of a possible application health problem. However, you also need to watch the watcher -the monitoring instance itself – and be notified if it becomes unhealthy. Which of the following is a simple way to achieve that goal? [PROFESSIONAL]
Run another monitoring instance that pings the monitoring instance and fires a CloudWatch alarm that notifies your operations team should the primary monitoring instance become unhealthy.
Set a CloudWatch alarm based on EC2 system and instance status checks and have the alarm notify your operations team of any detected problem with the monitoring instance.
Set a CloudWatch alarm based on the CPU utilization of the monitoring instance and have the alarm notify your operations team if the CPU usage exceeds 50% for more than one minute: then have your monitoring application go into a CPU-bound loop should it detect any application problems.
Have the monitoring instances post messages to an SQS queue and then dequeue those messages on another instance should the queue cease to have new messages, the second instance should first terminate the original monitoring instance start another backup monitoring instance and assume the role of the previous monitoring instance and beginning adding messages to the SQS queue.
A company wants to reduce alarm noise in their monitoring system. They have multiple alarms for different components of a web application. Which CloudWatch feature should they use to consolidate multiple alarms into a single notification?
CloudWatch Metrics Insights
CloudWatch Composite Alarms (Composite alarms combine multiple alarm states using Boolean logic to reduce noise and send notifications only at an aggregated level)
CloudWatch Anomaly Detection
CloudWatch Dashboards
A DevOps team wants to automatically identify root causes when CloudWatch alarms fire, correlating metrics, logs, and deployment events without manual investigation. Which CloudWatch feature should they use?
CloudWatch Logs Insights
CloudWatch Contributor Insights
CloudWatch Investigations (Powered by Amazon Q Developer, Investigations uses AI to analyze multiple telemetry sources and suggest root causes and remediation steps)
CloudWatch Application Signals
An organization wants to send application metrics to CloudWatch using open standards without vendor-specific conversion logic. They need support for high-cardinality metrics with many labels. Which approach should they use?
Use CloudWatch PutMetricData API with custom metrics
Use CloudWatch Metric Streams to export to a third-party tool
Send metrics directly using the OpenTelemetry Protocol (OTLP) to CloudWatch’s native OTel endpoint (CloudWatch supports native OTLP metrics ingestion with up to 150 labels per metric, queryable via PromQL)
Use the CloudWatch Agent with StatsD protocol
A company wants to ingest, transform, and route log data from multiple sources to CloudWatch without managing any infrastructure. They need to parse complex log formats and enrich the data during ingestion. Which service should they use?
CloudWatch Logs Subscription Filters
Amazon Kinesis Data Firehose
CloudWatch Pipelines (CloudWatch Pipelines is a fully managed service that ingests, transforms, and routes log data with support for parsing, conditional processing, and AI-assisted processor configuration)
CloudWatch Log Transformers only
A team needs to monitor their application’s availability, latency, and error rate with pre-built dashboards and set up Service Level Objectives (SLOs) without building custom monitoring. Which CloudWatch capability provides this?
CloudWatch Synthetics
CloudWatch Container Insights
CloudWatch Internet Monitor
CloudWatch Application Signals (Application Signals provides automatic instrumentation, pre-built APM dashboards with golden metrics, and SLO tracking without custom setup)
CloudWatch Logs can be used to monitor, store, and access log files from EC2 instances, CloudTrail, Route 53, and other sources.
CloudWatch Logs uses the log data for monitoring with no code changes required.
CloudWatch Logs requires the unified CloudWatch agent to be installed on EC2 instances and on-premises servers. (Note: The older CloudWatch Logs agent is deprecated and no longer supported. Use the unified CloudWatch agent instead.)
The unified CloudWatch agent can collect both logs and metrics from EC2 instances and on-premises servers.
A VPC endpoint can be configured to keep traffic between VPC and CloudWatch Logs from leaving the Amazon network. It doesn’t require an IGW, NAT, VPN connection, or Direct Connect connection.
CloudWatch Logs allows exporting log data from log groups to an S3 bucket, which can then be used for custom processing and analysis, or to load onto other systems.
Log data is encrypted while in transit and while it is at rest.
Log data can be encrypted using AWS KMS customer managed keys (CMK).
CloudWatch Logs now supports log events up to 1 MB in size (increased from the previous 256 KB limit, as of April 2025).
Required Mainly for SysOps Associate & DevOps Professional Exam
CloudWatch Logs Concepts
Log Events
A log event is a record of some activity recorded by the application or resource being monitored.
Log event record contains two properties: the timestamp of when the event occurred, and the raw event message.
Log Streams
A log stream is a sequence of log events that share the same source for e.g. log events from an Apache access log on a specific host.
Log Groups
Log groups define groups of log streams that share the same retention, monitoring, and access control settings for e.g. Apache access logs from each host grouped through log streams into a single log group.
Each log stream has to belong to one log group.
There is no limit on the number of log streams that can belong to one log group.
Log Classes
CloudWatch Logs offers two log classes:
Standard – Full-featured log class with real-time monitoring, anomaly detection, Live Tail, Logs Insights, metric filters, subscription filters, and all CloudWatch Logs capabilities.
Infrequent Access (IA) – Lower-cost log class (50% lower per GB ingestion price) designed for logs that are queried occasionally, such as forensic investigations and compliance auditing. Supports Logs Insights queries, export to S3, encryption, and data protection.
Log class is set at log group creation time and cannot be changed.
Infrequent Access does not support metric filters, subscription filters, Live Tail, or anomaly detection.
Metric Filters
Metric filters can be used to extract metric observations from ingested events and transform them to data points in a CloudWatch metric.
Metric filters are assigned to log groups, and all of the filters assigned to a log group are applied to their log streams.
Metric filters are only available for log groups in the Standard log class.
Retention Settings
Retention settings can be used to specify how long log events are kept in CloudWatch Logs.
Expired log events get deleted automatically.
Retention settings are assigned to log groups, and the retention assigned to a log group is applied to their log streams.
CloudWatch Logs Features
CloudWatch Logs Insights
CloudWatch Logs Insights is an interactive, purpose-built query language for searching and analyzing log data.
Supports queries across multiple log groups and multiple AWS accounts.
Automatically discovers fields in JSON-format logs and generates visualizations.
Supports OpenSearch SQL and PPL (Piped Processing Language) directly within the Logs Insights console for SQL-based log analytics and JOIN operations across log groups (launched Dec 2024).
Field Indexes (Nov 2024) – Index critical log attributes (e.g., requestId, transactionId) to accelerate query performance and reduce scan volume. Up to 20 fields can be indexed per log group. Available at no additional cost.
AI-Powered Natural Language Query Generation (June 2024) – Generate Logs Insights queries using plain language, powered by generative AI.
Scheduled Queries (Nov 2025) – Automate log analysis by running Logs Insights queries on a recurring schedule, delivering results to S3 or EventBridge.
23 New Query Commands and Functions (June 2026) – Includes hash functions (md5, sha256), string functions (strcontains with case-insensitive search, split), conditional logic (if statement), conversion functions (toNumber, toInt, toLong, toDouble), CSV/XML parsing, histogram, and multi-stage pipes for stats.
Facets (June 2026) – Explore log data visually without writing a query for interactive log exploration.
Parameterized Queries (June 2026) – Save reusable query templates with fill-in variables.
JOIN and Sub-queries (June 2026) – Correlate data across log groups in a single query.
Live Tail
Live Tail (launched June 2023) provides real-time streaming of log events as they are ingested into log groups.
Helps quickly view, filter, and troubleshoot issues in incoming logs without writing queries.
Supports fine-grained controls to filter and highlight attributes of interest, and pause/replay logs.
A Live Tail session can last for up to 3 hours.
Available via console, CLI (streaming support added June 2024), and API.
Integrated natively into the AWS Lambda console for real-time function log visibility (Oct 2024).
Only available for Standard log class.
Anomaly Detection and Pattern Analytics
Anomaly Detection (launched Nov 2023) uses machine learning algorithms trained on decades of Amazon and AWS operational data to automatically identify anomalies in log data.
Anomaly detectors train on the past two weeks of log events (training takes up to 15 minutes) and then continuously analyze incoming logs.
Default quota: up to 500 anomaly detectors per account (increased from 10 in Oct 2024).
Pattern Analytics automatically recognizes and clusters patterns among log records, extracting noteworthy content and trends.
Pattern and diff commands use named tokens for easier-to-read results.
Only available for Standard log class.
Log Transformation and Enrichment
Log Transformation (launched Nov 2024) normalizes logs into a consistent format at the time of ingestion.
Supports pre-configured templates for common AWS services (WAF, VPC Flow Logs) and custom transformers (Grok patterns).
Each transformer can extract up to 200 fields from a log event.
Transformed logs can be leveraged for field indexes, discovered fields in Logs Insights, metric filters, and subscription filters.
Included with existing Standard log class ingestion price (no additional cost for transformation).
Supports OCSF (Open Cybersecurity Schema Framework) and OTel format conversion for security and compliance data.
Log Analytics (Unified Console)
Log Analytics (launched June 2026) is a unified console experience that brings together:
CloudWatch Logs Insights for querying and analyzing log data
Live Tail for real-time log streaming
Contributor Insights for identifying top contributors
Supports multiple queries in different tabs simultaneously.
Combines facets, saved queries with parameters, natural language query generation, and visualizations in a single interface.
CloudWatch Logs Use Cases
Monitor Logs from EC2 Instances in Real-time
Can help monitor applications and systems using log data.
Can help track number of errors for e.g. 404, 500, or even specific literal terms “NullReferenceException”, occurring in applications, which can then be matched to a threshold to send notification.
Monitor AWS CloudTrail Logged Events
Can be used to monitor particular API activity as captured by CloudTrail by creating alarms in CloudWatch and receiving notifications.
Archive Log Data
Can help store log data in highly durable storage, an alternative to S3.
Log retention setting can be modified, so that any log events older than this setting are automatically deleted.
Log Route 53 DNS Queries
Can help log information about the DNS queries that Route 53 receives.
Managed Syslog Ingestion
Managed Syslog Ingestion (launched June 2026) enables sending syslog messages from firewalls, routers, switches, and Linux servers directly into CloudWatch Logs.
Eliminates the need for custom syslog collection infrastructure.
Real-time Processing of Log Data with Subscriptions
Subscriptions provide access to a real-time feed of log events from CloudWatch Logs and deliver them to other services such as Kinesis Data Streams, Amazon Data Firehose, AWS Lambda, or Amazon OpenSearch Service for custom processing, analysis, or loading to other systems.
A subscription filter defines the filter pattern to use for filtering which log events get delivered, as well as the destination for matching log events.
CloudWatch Logs log group can be configured to stream data to an Amazon OpenSearch Service cluster in near real-time. (Note: Amazon Elasticsearch Service was renamed to Amazon OpenSearch Service in September 2021.)
Account-Level Subscription Filters (Jan 2024) – Deliver real-time log events from all log groups in an account to a Kinesis Data Stream, Amazon Data Firehose, or Lambda using a single account-level filter (one per account per Region).
Cross-Account and Cross-Region Log Centralization
Cross-Account Observability enables searching log groups across multiple accounts, running cross-account Logs Insights queries, and creating Contributor Insights rules.
Cross-Account and Cross-Region Log Centralization (Sept 2025) copies log data from multiple AWS accounts and regions into a single destination account for centralized management.
Searching and Filtering
CloudWatch Logs allows searching and filtering the log data by creating one or more metric filters.
Metric filters define the terms and patterns to look for in log data as it is sent to CloudWatch Logs.
CloudWatch Logs uses these metric filters to turn log data into numerical CloudWatch metrics that can be graphed or used to set alarms.
AWS Certification Exam Practice Questions
Questions are collected from Internet and the answers are marked as per my knowledge and understanding (which might differ with yours).
AWS services are updated everyday and both the answers and questions might be outdated soon, so research accordingly.
AWS exam questions are not updated to keep up the pace with AWS updates, so even if the underlying feature has changed the question might not be updated
Open to further feedback, discussion and correction.
Once we have our logs in CloudWatch, we can do a number of things such as: Choose 3. Choose the 3 correct answers:[CDOP]
Send the log data to AWS Lambda for custom processing or to load into other systems
Stream the log data to Amazon Kinesis
Stream the log data into Amazon OpenSearch Service in near real-time with CloudWatch Logs subscriptions.
Record API calls for your AWS account and delivers log files containing API calls to your Amazon S3 bucket
You have decided to set the threshold for errors on your application to a certain number and once that threshold is reached you need to alert the Senior DevOps engineer. What is the best way to do this? Choose 3. Choose the 3 correct answers: [CDOP]
Set the threshold your application can tolerate in a CloudWatch Logs group and link a CloudWatch alarm on that threshold.
Use the unified CloudWatch agent to send log data from the app to CloudWatch Logs from Amazon EC2 instances
Pipe data from EC2 to the application logs using AWS Data Pipeline and CloudWatch
Once a CloudWatch alarm is triggered, use SNS to notify the Senior DevOps Engineer.
You are hired as the new head of operations for a SaaS company. Your CTO has asked you to make debugging any part of your entire operation simpler and as fast as possible. She complains that she has no idea what is going on in the complex, service-oriented architecture, because the developers just log to disk, and it’s very hard to find errors in logs on so many services. How can you best meet this requirement and satisfy your CTO? [CDOP]
Copy all log files into AWS S3 using a cron job on each instance. Use an S3 Notification Configuration on the PutBucket event and publish events to AWS Lambda. Use the Lambda to analyze logs as soon as they come in and flag issues. (is not fast in search and introduces delay)
Begin using CloudWatch Logs on every service. Stream all Log Groups into S3 objects. Use AWS EMR cluster jobs to perform adhoc MapReduce analysis and write new queries when needed. (is not fast in search and introduces delay)
Copy all log files into AWS S3 using a cron job on each instance. Use an S3 Notification Configuration on the PutBucket event and publish events to AWS Kinesis. Use Apache Spark on AWS EMR to perform at-scale stream processing queries on the log chunks and flag issues. (is not fast in search and introduces delay)
Begin using CloudWatch Logs on every service. Stream all Log Groups into an Amazon OpenSearch Service domain running OpenSearch Dashboards and perform log analysis on a search cluster. (OpenSearch with Dashboards (formerly ELK – Elasticsearch, Kibana stack) is designed specifically for real-time, ad-hoc log analysis and aggregation)
You use Amazon CloudWatch as your primary monitoring system for your web application. After a recent software deployment, your users are getting Intermittent 500 Internal Server Errors when using the web application. You want to create a CloudWatch alarm, and notify an on-call engineer when these occur. How can you accomplish this using AWS services? (Choose three.) [CDOP]
Deploy your web application as an AWS Elastic Beanstalk application. Use the default Elastic Beanstalk CloudWatch metrics to capture 500 Internal Server Errors. Set a CloudWatch alarm on that metric.
Install the unified CloudWatch agent on your servers to stream web application logs to CloudWatch.
Use Amazon Simple Email Service to notify an on-call engineer when a CloudWatch alarm is triggered.
Create a CloudWatch Logs group and define metric filters that capture 500 Internal Server Errors. Set a CloudWatch alarm on that metric.
Use Amazon Simple Notification Service to notify an on-call engineer when a CloudWatch alarm is triggered.
Use AWS Data Pipeline to stream web application logs from your servers to CloudWatch.
A company needs to consolidate logs from multiple AWS accounts for compliance auditing but wants to minimize costs since logs are only queried during investigations. Which CloudWatch Logs approach is most cost-effective? [SAA/SysOps]
Use Standard log class with metric filters for all log groups
Use Infrequent Access log class for the log groups and query with Logs Insights when needed
Export all logs to S3 immediately and use Athena for queries
Use Live Tail to monitor logs in real-time across accounts
A DevOps team wants to quickly identify anomalous log patterns after a deployment without writing custom detection rules. Which CloudWatch Logs feature should they use? [CDOP]
Metric filters with CloudWatch Alarms
CloudWatch Logs Insights scheduled queries
CloudWatch Logs Anomaly Detection with pattern analytics
Subscription filters to Lambda for custom processing
A team needs to stream log events from ALL log groups in their AWS account to a central Kinesis Data Stream without creating individual subscription filters for each log group. What should they use? [CDOP]
Cross-account observability with a monitoring account
CloudWatch Logs transformation with Kinesis destination
Account-level subscription filter policy
CloudWatch Logs Live Tail with CLI streaming
An engineer wants to speed up CloudWatch Logs Insights queries that frequently filter by requestId across large log groups. Which feature should they configure? [CDOP/SysOps]
AWS Organizations is an account management service that enables consolidating multiple AWS accounts into an organization that can be created and centrally managed.
AWS Organizations enables you to
Automate AWS account creation and management, and provision resources with AWS CloudFormation Stacksets
Maintain a secure environment with policies and management of AWS security services
Govern access to AWS services, resources, and regions
Centrally manage policies across multiple AWS accounts
gives developers and systems administrators an easy way to create and manage a collection of related AWS resources
Resources can be updated, deleted, and modified in an orderly, controlled and predictable fashion, in effect applying version control to the AWS infrastructure as code done for software code
CloudFormation Template is an architectural diagram, in JSON or YAML format, and Stack is the end result of that diagram, which is actually provisioned
template can be used to set up the resources consistently and repeatedly over and over across multiple regions and consists of
List of AWS resources and their configuration values
An optional template file format version number
An optional list of template parameters (input values supplied at stack creation time)
An optional list of output values like public IP address using the Fn::GetAtt function
An optional list of data tables used to lookup static configuration values for e.g., AMI names per AZ
supports Chef & Puppet Integration to deploy and configure right down the application layer
supports Bootstrap scripts to install packages, files, and services on the EC2 instances by simply describing them in the CF template
automatic rollback on error feature is enabled, by default, which will cause all the AWS resources that CF created successfully for a stack up to the point where an error occurred to be deleted
provides a WaitCondition resource to block the creation of other resources until a completion signal is received from an external source
allows DeletionPolicy attribute to be defined for resources in the template
retain to preserve resources like S3 even after stack deletion
snapshot to backup resources like RDS after stack deletion
DependsOn attribute to specify that the creation of a specific resource follows another
Service role is an IAM role that allows AWS CloudFormation to make calls to resources in a stack on the user’s behalf
Nested stacks can separate out reusable, common components and create dedicated templates to mix and match different templates but use nested stacks to create a single, unified stack
Change Sets presents a summary or preview of the proposed changes that CloudFormation will make when a stack is updated
Drift detection enables you to detect whether a stack’s actual configuration differs, or has drifted, from its expected configuration.
Termination protection helps prevent a stack from being accidentally deleted.
Stack policy can prevent stack resources from being unintentionally updated or deleted during a stack update.
StackSets extends the functionality of stacks by enabling you to create, update, or delete stacks across multiple accounts and Regions with a single operation.
IaC Generator(launched Feb 2024)
Generates CloudFormation templates and AWS CDK apps for existing AWS resources that are not managed with CloudFormation.
Scans resources in an AWS account, identifies relationships, and generates templates.
Supports targeted resource scans for faster template generation.
Helps onboard existing resources to CloudFormation management.
Hooks
Extension points that invoke custom logic at specific points during stack operations for validation or enforcement.
Can be created using AWS Lambda, CloudFormation Guard rules, or the CFN-CLI.
Now supports managed proactive controls from AWS Control Tower Controls Catalog (2025).
makes it easier for developers to quickly deploy and manage applications in the AWS cloud.
automatically handles the deployment details of capacity provisioning, load balancing, auto-scaling and application health monitoring
CloudFormation supports ElasticBeanstalk
provisions resources to support
a web application that handles HTTP(S) requests or
a web application that handles background-processing (worker) tasks
supports Out Of the Box
Apache Tomcat for Java applications
Apache HTTP Server for PHP applications
Apache HTTP server for Python applications
Nginx or Apache HTTP Server for Node.js applications
Passenger for Ruby applications
Microsoft IIS for .NET applications
Single and Multi Container Docker
Go applications
supports custom AMI to be used
is designed to support multiple running environments such as one for Dev, QA, Pre-Prod and Production.
supports versioning and stores and tracks application versions over time allowing easy rollback to prior version
can provision RDS DB instance and connectivity information is exposed to the application by environment variables, but is NOT recommended for production setup as the RDS is tied up with the Elastic Beanstalk lifecycle and if deleted, the RDS instance would be deleted as well
Amazon Linux 2023 (AL2023) is the current recommended platform. Amazon Linux 2 (AL2) standard support ends June 30, 2026. Platform branches based on Amazon Linux AMI (AL1) are retired.
supports AI-powered log analysis using Amazon Nova for improved reliability in troubleshooting.
AWS OpsWorks Stacks reached End of Life (EOL) on May 26, 2024. The service has been disabled for both new and existing customers. The OpsWorks console, API, CLI, and CloudFormation resources have been discontinued in all AWS Regions.
Migration Options:
AWS Systems Manager — for configuration management, patching, and automation
AWS CloudFormation / CDK — for infrastructure as code provisioning
AWS Elastic Beanstalk — for application deployment and management
is a configuration management service that helps to configure and operate applications in a cloud enterprise by using Chef
helps deploy and monitor applications in stacks with multiple layers
supports preconfigured layers for Applications, Databases, Load Balancers, Caching
OpsWorks Stacks features is a set of lifecycle events – Setup, Configure, Deploy, Undeploy, and Shutdown – which automatically runs specified set of recipes at the appropriate time on each instance
Layers depend on Chef recipes to handle tasks such as installing packages on instances, deploying apps, running scripts, and so on
OpsWorks Stacks runs the recipes for each layer, even if the instance belongs to multiple layers
supports Auto Healing and Auto Scaling to monitor instance health, and provision new instances
allows monitoring of AWS resources and applications in real time, collect and track pre configured or custom metrics and configure alarms to send notification or make resource changes based on defined rules
does not aggregate data across regions
stores the log data indefinitely, and the retention can be changed for each log group at any time
alarm history is stored for only 14 days
can be used an alternative to S3 to store logs with the ability to configure Alarms and generate metrics, however logs cannot be made public
Alarms exist only in the created region and the Alarm actions must reside in the same region as well
Application Signals(GA June 2024)
Provides a unified, application-centric view of applications, services, and dependencies.
Automatic instrumentation across Amazon ECS, EKS, Lambda, and EC2 — no custom code or dashboards needed.
Pre-built dashboards showing volume, availability, latency, faults, and errors.
Supports Service Level Objectives (SLOs) and health indicators.
Application map automatically discovers and visualizes application topology.
Network Monitoring
Internet Monitor — provides near-continuous internet measurements (availability and performance) tailored to your workload footprint on AWS.
Network Flow Monitor — tracks network metrics (data transferred, retransmissions, round-trip time) between compute resources using lightweight agents.
Network Synthetic Monitor — visualizes packet loss and latency of hybrid network connections.
records access to API calls for the AWS account made from AWS management console, SDKs, CLI and higher level AWS service
support many AWS services and tracks who did, from where, what & when
is a global service — a trail can be applied to all regions or a single region. A region can include global services (like IAM, STS etc), is applicable to all the supported services within that region
log files from different regions can be sent to the same S3 bucket
can be integrated with SNS to notify logs availability, CloudWatch logs log group for notifications when specific API events occur
call history enables security analysis, resource change tracking, trouble shooting and compliance auditing
CloudTrail Lake
A managed data lake for capturing, storing, and analyzing AWS activity logs.
AI-powered features for log analysis and pre-built dashboards (Nov 2024).
⚠️ CloudTrail Lake is no longer open to new customers starting May 31, 2026. Existing customers can continue use. AWS recommends Amazon CloudWatch for similar capabilities going forward.
CloudWatch offers either basic or detailed monitoring for supported AWS services.
Basic monitoring means that a service sends data points to CloudWatch every five minutes.
Detailed monitoring means that a service sends data points to CloudWatch every minute.
If the AWS service supports both basic and detailed monitoring, the basic would be enabled by default and the detailed monitoring needs to be enabled for detailed metrics.
High-Resolution Custom Metrics allow publishing data at 1-second resolution using the PutMetricData API with a StorageResolution of 1.
Monitoring Categories
Basic Monitoring – Free, default set of metrics published at 5-minute intervals for most services.
Detailed Monitoring – Paid, more frequent metrics (typically 1-minute intervals). Must be explicitly enabled.
High-Resolution Custom Metrics – Custom metrics published at up to 1-second intervals using PutMetricData API or Embedded Metric Format (EMF).
Services Offering Detailed Monitoring
The following services officially offer detailed monitoring (paid, more fine-grained metrics):
Amazon API Gateway – Additional dimensions for detailed metrics
AWS AppSync – Detailed CloudWatch metrics
Amazon CloudFront – Additional distribution metrics
Amazon SES – Detailed monitoring via event publishing
AWS Services with Monitoring Support
Auto Scaling
By default, basic monitoring is enabled when the launch configuration is created using the AWS Management Console, and detailed monitoring is enabled when the launch configuration is created using the AWS CLI or an API.
Auto Scaling sends data to CloudWatch every 5 minutes by default when created from Console.
For an additional charge, you can enable detailed monitoring for Auto Scaling, which sends data to CloudWatch every minute.
Amazon CloudFront
Amazon CloudFront sends data to CloudWatch every minute by default.
Additional distribution metrics (detailed monitoring) can be enabled for more fine-grained visibility.
Amazon CloudSearch
Amazon CloudSearch sends data to CloudWatch every minute by default.
Amazon EventBridge sends data to CloudWatch every minute by default.
Amazon CloudWatch Logs
Amazon CloudWatch Logs sends data to CloudWatch every minute by default.
Amazon DynamoDB
Amazon DynamoDB sends data to CloudWatch every minute for some metrics and every 5 minutes for other metrics.
DynamoDB Contributor Insights provides additional metrics for table and global secondary index access patterns.
Amazon Elastic Container Service (Amazon ECS)
Amazon ECS sends data to CloudWatch every minute.
Container Insights provides additional detailed metrics at the cluster, service, task, and container level including CPU, memory, network, and storage metrics.
Amazon ElastiCache
Amazon ElastiCache sends data to CloudWatch every minute.
Amazon Elastic Block Store (EBS)
Amazon EBS sends data to CloudWatch every 5 minutes for gp2, st1, and sc1 volumes.
Provisioned IOPS SSD (io1 and io2) volumes automatically send one-minute metrics to CloudWatch.
gp3 volumes also send metrics at 1-minute intervals.
Amazon Elastic Compute Cloud (EC2)
Amazon EC2 sends data to CloudWatch every 5 minutes by default. For an additional charge, you can enable detailed monitoring for Amazon EC2, which sends data to CloudWatch every minute.
Elastic Load Balancing
Elastic Load Balancing sends data to CloudWatch every minute (applies to ALB, NLB, GLB, and Classic Load Balancer).
Amazon EMR (formerly Amazon Elastic MapReduce)
Amazon EMR sends basic data to CloudWatch every 5 minutes by default at no additional cost.
Starting with Amazon EMR Release 7.0+, the CloudWatch Agent can publish 34 enhanced metrics every minute (additional charges apply).
EMR Serverless sends metrics to CloudWatch every minute.
Amazon OpenSearch Service (formerly Amazon Elasticsearch Service)
Amazon OpenSearch Service sends data to CloudWatch every minute.
Amazon Kinesis Data Streams (formerly Amazon Kinesis Streams)
Amazon Kinesis Data Streams sends stream-level data to CloudWatch every minute.
Enhanced shard-level metrics (detailed monitoring) provide additional per-shard metrics.
Amazon Data Firehose (formerly Amazon Kinesis Data Firehose)
Amazon Data Firehose sends data to CloudWatch every minute.
AWS Lambda
AWS Lambda sends data to CloudWatch every minute.
Lambda Insights provides enhanced monitoring with system-level metrics (CPU, memory, network) at 1-minute intervals.
Amazon SageMaker AI
Amazon SageMaker AI (which replaced the legacy Amazon Machine Learning service) sends training, endpoint, and transform job metrics to CloudWatch every minute.
⚠️ Note: The original Amazon Machine Learning service is no longer accepting new users. AWS recommends using Amazon SageMaker AI for machine learning workloads.
Amazon Redshift
Amazon Redshift sends data to CloudWatch every minute.
Amazon Relational Database Service (RDS)
Amazon RDS sends data to CloudWatch every minute.
CloudWatch Database Insights (launched Dec 2024) provides comprehensive database observability with fleet-level and instance-level dashboards.
Amazon Route 53
Amazon Route 53 sends data to CloudWatch every minute.
Amazon Simple Notification Service (SNS)
Amazon SNS sends data to CloudWatch every 5 minutes.
SNS does not support detailed (1-minute) monitoring.
Amazon Simple Queue Service (SQS)
Amazon SQS sends data to CloudWatch every 5 minutes.
Amazon Simple Storage Service (S3)
Amazon S3 sends storage metrics (bucket size, object count) to CloudWatch once a day (basic monitoring, free).
Request metrics (detailed monitoring) are available at 1-minute intervals and are billed as CloudWatch custom metrics.
1-minute metrics are available at the bucket-level by default when request metrics are enabled.
Amazon Simple Workflow Service (SWF)
Amazon SWF sends data to CloudWatch every 5 minutes.
Note: AWS Step Functions is the recommended alternative for new workflow orchestration workloads.
AWS Storage Gateway
AWS Storage Gateway sends data to CloudWatch every 5 minutes.
AWS WAF
AWS WAF sends data to CloudWatch every minute.
Amazon WorkSpaces
Amazon WorkSpaces sends data to CloudWatch every 5 minutes.
⚠️ AWS OpsWorks – End of Life
AWS OpsWorks reached End of Life (EOL) on May 26, 2024. The service has been disabled for both new and existing customers. The OpsWorks console, API, CLI, and CloudFormation resources are no longer available.
The following additional AWS services publish metrics to CloudWatch (not in the original list):
Amazon API Gateway – Sends metrics every minute
AWS AppSync – Sends metrics every minute
Amazon EKS – Control plane metrics and Container Insights
Amazon Bedrock – Model invocation and throughput metrics
AWS Step Functions – Execution metrics every minute
Amazon Aurora – Database metrics every minute (with Database Insights)
AWS Fargate – Container-level metrics via Container Insights
Amazon MSK – Streaming metrics with per-broker/topic detail
AWS Network Firewall – Firewall metrics every minute
Amazon MemoryDB – Database metrics every minute
CloudWatch Enhanced Observability Features
Container Insights – Collects and aggregates metrics and logs from containerized applications on Amazon ECS, Amazon EKS, and Kubernetes. Provides cluster, node, pod, task, and service level metrics.
Lambda Insights – Enhanced monitoring for Lambda functions with system-level metrics (CPU, memory, network, disk).
Database Insights (Dec 2024) – Comprehensive database observability for Amazon RDS and Aurora with fleet-level health monitoring and instance-level SQL query analysis.
Application Signals (June 2024) – Application performance monitoring (APM) with pre-built dashboards showing volume, availability, latency, faults, and errors.
Internet Monitor – Near-continuous internet measurements for availability and performance, tailored to your workload footprint on AWS.
CloudWatch Investigations – AI-powered investigation of operational issues across services.
AWS Certification Exam Practice Questions
Questions are collected from Internet and the answers are marked as per my knowledge and understanding (which might differ with yours).
AWS services are updated everyday and both the answers and questions might be outdated soon, so research accordingly.
AWS exam questions are not updated to keep up the pace with AWS updates, so even if the underlying feature has changed the question might not be updated
Open to further feedback, discussion and correction.
What is the minimum time interval for the data that Amazon CloudWatch receives and aggregates?
One second (High-resolution custom metrics support 1-second resolution)
Five seconds
One minute
Three minutes
Five minutes
Note: The original answer was “One minute” which was correct for standard metrics. With high-resolution custom metrics (introduced 2017), CloudWatch supports 1-second resolution. Exam questions may still reference 1 minute as the minimum for AWS service metrics.
In the ‘Detailed’ monitoring data available for your Amazon EBS volumes, Provisioned IOPS volumes automatically send _____ minute metrics to Amazon CloudWatch.
3
1
5
2
Using Amazon CloudWatch’s Free Tier, what is the frequency of metric updates, which you receive?
5 minutes
500 milliseconds.
30 seconds
1 minute
What is the type of monitoring data (for Amazon EBS volumes) which is available automatically in 5-minute periods at no charge called?
Basic
Primary
Detailed
Local
A user has created an Auto Scaling group using CLI. The user wants to enable CloudWatch detailed monitoring for that group. How can the user configure this?
When the user sets an alarm on the Auto Scaling group, it automatically enables detail monitoring
By default detailed monitoring is enabled for Auto Scaling (Detailed monitoring is enabled when you create the launch configuration using the AWS CLI or an API)
Auto Scaling does not support detailed monitoring
Enable detail monitoring from the AWS console
A user is trying to understand the detailed CloudWatch monitoring concept. Which of the below mentioned services provides detailed monitoring with CloudWatch without charging the user extra?
AWS Auto Scaling
AWS Route 53
AWS EMR
AWS SNS
A user is trying to understand the detailed CloudWatch monitoring concept. Which of the below mentioned services does not provide detailed monitoring with CloudWatch?
AWS EMR (EMR sends basic metrics every 5 minutes by default; enhanced monitoring at 1-minute intervals is available starting with EMR 7.0+ via CloudWatch Agent)
AWS RDS
AWS ELB
AWS Route53
A user has enabled detailed CloudWatch monitoring with the AWS Simple Notification Service. Which of the below mentioned statements helps the user understand detailed monitoring better?
SNS will send data every minute after configuration
There is no need to enable since SNS provides data every minute
AWS CloudWatch does not support monitoring for SNS
SNS cannot provide data every minute
A user has configured an Auto Scaling group with ELB. The user has enabled detailed CloudWatch monitoring on Auto Scaling. Which of the below mentioned statements will help the user understand the functionality better?
It is not possible to setup detailed monitoring for Auto Scaling
In this case, Auto Scaling will send data every minute and will charge the user extra
Detailed monitoring will send data every minute without additional charges
Auto Scaling sends data every minute only and does not charge the user
Which of the following CloudWatch monitoring features provides near real-time visibility into application performance with pre-built dashboards?
CloudWatch Logs Insights
CloudWatch Alarms
CloudWatch Application Signals
CloudWatch Contributor Insights
What is the minimum resolution supported by CloudWatch high-resolution custom metrics?
5 seconds
10 seconds
30 seconds
1 second
Which CloudWatch feature provides comprehensive database observability with fleet-level health monitoring for Amazon RDS and Aurora?
Elastic Load Balancing publishes data points to Amazon CloudWatch about the load balancers and targets (or back-end instances for Classic Load Balancer).
Elastic Load Balancing reports metrics to CloudWatch only when requests are flowing through the load balancer.
If there are requests flowing through the load balancer, Elastic Load Balancing measures and sends its metrics in 60-second intervals.
If there are no requests flowing through the load balancer or no data for a metric, the metric is not reported.
AWS provides four types of load balancers, each with its own monitoring capabilities:
Number of HTTP response codes generated by registered instances.
Most useful statistic is Sum.
Application Load Balancer (ALB) Metrics
ALB metrics use the AWS/ApplicationELB namespace.
ActiveConnectionCount – Total concurrent TCP connections active from clients to the load balancer and from the load balancer to targets. Useful statistic: Sum.
NewConnectionCount – Total new TCP connections established from clients to the load balancer and from the load balancer to targets. Useful statistic: Sum.
RejectedConnectionCount – Number of connections rejected because the load balancer reached its maximum number of connections. Useful statistic: Sum.
RequestCount – Number of requests processed over IPv4 and IPv6. Useful statistic: Sum.
TargetResponseTime – Time elapsed after the request leaves the load balancer until the target starts to send response headers. Useful statistics: Average, pNN.NN (percentiles).
HealthyHostCount, UnHealthyHostCount – Number of healthy/unhealthy targets. Useful statistics: Average, Min, Max.
HTTPCode_Target_2XX_Count through 5XX_Count – HTTP response codes generated by targets. Useful statistic: Sum.
HTTPCode_ELB_4XX_Count, HTTPCode_ELB_5XX_Count – HTTP error codes generated by the load balancer itself. Useful statistic: Sum.
ClientTLSNegotiationErrorCount – TLS connections initiated by clients that did not establish a session with the load balancer. Useful statistic: Sum.
TargetConnectionErrorCount – Connections that were not successfully established between the load balancer and target. Useful statistic: Sum.
ProcessedBytes – Total bytes processed by the load balancer over IPv4 and IPv6. Useful statistic: Sum.
ConsumedLCUs – Number of Load Balancer Capacity Units (LCU) consumed. Used for billing calculations.
RuleEvaluations – Number of rules evaluated while processing requests.
AnomalousHostCount – Number of targets detected with anomalies (used with Automatic Target Weights). Useful statistics: Min, Max.
Network Load Balancer (NLB) Metrics
NLB metrics use the AWS/NetworkELB namespace.
ActiveFlowCount – Total number of concurrent flows (connections) from clients to targets. Useful statistic: Average.
NewFlowCount – Total number of new flows established from clients to targets. Useful statistic: Sum.
ProcessedBytes – Total bytes processed by the load balancer (TCP/TLS, UDP). Useful statistic: Sum.
TCP_Client_Reset_Count, TCP_Target_Reset_Count, TCP_ELB_Reset_Count – Number of reset (RST) packets sent from client, target, or the load balancer.
HealthyHostCount, UnHealthyHostCount – Number of healthy/unhealthy targets.
ConsumedLCUs – Number of Network Load Balancer Capacity Units consumed.
PeakBytesPerSecond – Highest average bytes per second for the load balancer during a period.
Gateway Load Balancer (GWLB) Metrics
GWLB metrics use the AWS/GatewayELB namespace.
ActiveFlowCount, NewFlowCount – Concurrent and new flows from clients to targets.
ProcessedBytes – Total bytes processed by the GWLB.
HealthyHostCount, UnHealthyHostCount – Number of healthy/unhealthy targets.
GWLB does NOT generate access logs since it is a transparent Layer 3 load balancer that does not terminate flows.
Elastic Load Balancer Access Logs
Elastic Load Balancing provides access logs that capture detailed information about all requests sent to the load balancer.
Each log contains information such as the time the request was received, the client’s IP address, latencies, request paths, and server responses.
Access logging is disabled by default and can be enabled without any additional charge. You are only charged for S3 storage.
Access logs are supported for ALB, NLB, and CLB. GWLB does not generate access logs.
ALB Access Logs
ALB publishes a log file for each load balancer node every 5 minutes to Amazon S3.
Log entries include: request type, timestamp, ELB name, client:port, target:port, request processing time, target processing time, response processing time, ELB/target status codes, received/sent bytes, request details, user agent, SSL cipher/protocol, target group ARN, trace ID, and more.
NLB Access Logs
NLB access logs capture information about TLS requests sent to the load balancer.
Logs can be stored in Amazon S3.
New (Nov 2025): NLB access logs now support delivery as CloudWatch Vended Logs, enabling direct delivery to CloudWatch Logs, Amazon Data Firehose, and Amazon S3 with Apache Parquet format support. This allows real-time log analysis using CloudWatch Logs Insights and Live Tail.
ALB Connection Logs
Connection logs capture detailed information about TLS connections established between clients and the ALB.
Connection logs are stored in Amazon S3, with a log file published every 5 minutes.
This is an optional feature, disabled by default.
Log entries include: timestamp, client IP:port, listener port, TLS protocol/cipher, connection status, client certificate details (for mTLS), and more.
ALB Health Check Logs
New (Nov 2025): ALB now supports Health Check Logs that send detailed target health check data directly to a designated Amazon S3 bucket.
This optional feature captures:
Health check status (healthy/unhealthy)
Timestamps
Target identification data
Failure reasons for unhealthy targets
Health check logs are published every 5 minutes per load balancer node.
Helps troubleshoot intermittent target health check failures without needing to rely solely on CloudWatch metrics.
No additional charge; you pay only for S3 storage.
CloudWatch Internet Monitor
Amazon CloudWatch Internet Monitor provides internet performance and availability measurements for user traffic to load balancers.
Monitors internet traffic patterns and identifies issues that affect internet connectivity between users and AWS.
Supported for both ALB and NLB.
NLB integration (Sep 2024): You can create or associate a monitor for an NLB directly when creating it in the AWS Management Console.
Provides city-level visibility into performance impairments and their geographic scope.
CloudWatch Network Flow Monitor
New (Dec 2024, re:Invent): CloudWatch Network Flow Monitor offers network performance monitoring across AWS managed services.
Provides near real-time visibility into network performance for traffic between compute resources (EC2, EKS), to AWS services (S3, DynamoDB), and to other AWS Regions.
Can determine if AWS is the cause of a detected network issue for monitored flows.
ALB Automatic Target Weights (ATW)
New (Nov 2023): ALB supports Automatic Target Weights (ATW), which uses anomaly detection to optimize traffic routing.
ATW detects and mitigates gray failures — situations where a target passes health checks but still returns elevated errors.
Anomaly detection is automatically enabled on HTTP/HTTPS target groups with at least three healthy targets.
ATW analyzes HTTP return status codes and TCP/TLS errors to identify anomalous targets and reduces traffic to them.
Provides the AnomalousHostCount CloudWatch metric to monitor detected anomalies.
CloudWatch Anomaly Detection Alarms
CloudWatch anomaly detection uses machine learning to model expected metric behavior and automatically creates upper and lower bounds.
Can be used with ELB metrics like TargetResponseTime, RequestCount, HTTPCode_ELB_5XX to detect unusual patterns.
Recommended approach for monitoring ELB performance without manually setting static thresholds.
Works with ALB, NLB, CLB, and GWLB metrics.
CloudTrail Logs
AWS CloudTrail captures all API calls to the Elastic Load Balancing API made by or on behalf of your AWS account.
API calls can be made directly, or indirectly through the AWS Management Console, AWS CLI, or SDKs.
CloudTrail stores the information as log files in an Amazon S3 bucket.
Logs can be used to monitor load balancer activity and determine what API call was made, what source IP address was used, who made the call, when it was made, and so on.
Applies to all ELB types (ALB, NLB, GWLB, CLB).
Classic Load Balancer – Migration Recommendation
⚠️ Note: Classic Load Balancer is the previous generation load balancer. AWS strongly recommends migrating to Application Load Balancer (Layer 7) or Network Load Balancer (Layer 4).
EC2-Classic networking was fully retired in August 2023. While CLB continues to function in VPC, no new features are being added to it. Use the AWS Migration Wizard to move to ALB or NLB.
AWS Certification Exam Practice Questions
Questions are collected from Internet and the answers are marked as per my knowledge and understanding (which might differ with yours).
AWS services are updated everyday and both the answers and questions might be outdated soon, so research accordingly.
AWS exam questions are not updated to keep up the pace with AWS updates, so even if the underlying feature has changed the question might not be updated
Open to further feedback, discussion and correction.
An admin is planning to monitor the ELB. Which of the below mentioned services does not help the admin capture the monitoring information about the ELB activity?
ELB Access logs
ELB health check
CloudWatch metrics
ELB API calls with CloudTrail
A customer needs to capture all client connection information from their load balancer every five minutes. The company wants to use this data for analyzing traffic patterns and troubleshooting their applications. Which of the following options meets the customer requirements?
Enable AWS CloudTrail for the load balancer.
Enable access logs on the load balancer.
Install the Amazon CloudWatch Logs agent on the load balancer.
Enable Amazon CloudWatch metrics on the load balancer.
Your supervisor has requested a way to analyze traffic patterns for your application. You need to capture all connection information from your load balancer every 10 minutes. Pick a solution from below. Choose the correct answer:
Enable access logs on the load balancer.
Create a custom metric CloudWatch filter on your load balancer.
Use a CloudWatch Logs Agent.
Use AWS CloudTrail with your load balancer.
A company runs a web application behind an Application Load Balancer. Some users are experiencing intermittent 5XX errors but health checks show all targets as healthy. Which ALB feature can automatically detect and mitigate this issue?
Cross-Zone Load Balancing
Automatic Target Weights (ATW)
Connection Draining
Sticky Sessions
A DevOps engineer needs to troubleshoot why targets behind an ALB are intermittently failing health checks. Which recently introduced feature provides detailed health check failure reasons stored in S3?
ALB Access Logs
CloudWatch HealthyHostCount metric
ALB Health Check Logs
AWS CloudTrail
A solutions architect wants to analyze NLB access logs in near real-time using CloudWatch Logs Insights. Which delivery option should they configure?
Enable NLB access logs to S3 and create Athena queries
Configure NLB access logs as CloudWatch Vended Logs
Enable VPC Flow Logs on the NLB
Install CloudWatch Agent on NLB nodes
Which of the following is a metric specific to Classic Load Balancer that indicates the load balancer cannot route requests because the queue is full?
RejectedConnectionCount
TargetConnectionErrorCount
SpilloverCount
HTTPCode_ELB_503
A company wants to identify if AWS infrastructure is causing latency issues for users connecting to their Network Load Balancer from different geographic locations. Which service should they use?