AWS X-Ray
⚠️ X-Ray SDK/Daemon Maintenance Mode Notice
As of February 25, 2026, the AWS X-Ray SDKs and Daemon have entered maintenance mode. AWS will limit releases to security fixes only — no new feature enhancements.
The X-Ray service itself remains fully supported and continues to receive new features (e.g., native OpenTelemetry support, CloudWatch Transaction Search).
Recommended Migration Path:
- AWS Distro for OpenTelemetry (ADOT) — AWS’s distribution of OpenTelemetry with zero-code auto-instrumentation
- OpenTelemetry SDKs — Industry-standard open-source instrumentation with X-Ray as backend
- CloudWatch Agent — Unified agent that can collect and send traces to X-Ray via OTLP
See Migration Guide for detailed instructions.
- AWS X-Ray helps developers analyze and debug production, distributed applications for e.g. built using a microservices lambda architecture
- provides an end-to-end view of requests as they travel through the application, and shows a map of the application’s underlying components.
- helps to understand how the application and its underlying services are performing to identify and troubleshoot the root cause of performance issues and errors.
- can help analyze applications in development and in production, from simple three-tier applications to complex microservices applications consisting of thousands of services.
- can be used with distributed applications of any size to trace and debug both synchronous requests and asynchronous events.
- can be used to track requests flowing through applications or services across multiple regions. Data is stored locally in the processed region and customers can build a solution over it to combine the data.
- makes the Trace data available for retrieval and filtering within 30 seconds of it being received by the service.
- stores trace data for the last 30 days.
- encrypts traces and related data at rest and supports encryption in transit.
- Integration
- X-Ray integrates with applications running on EC2, ECS, Lambda, Elastic Beanstalk, EKS, App Runner, and API Gateway.
- X-Ray SDK automatically captures metadata for API calls made to AWS services using the AWS SDK
- X-Ray SDK provides add-ons for MySQL and PostgreSQL drivers.
- For Elastic Beanstalk, include the language-specific libraries in the application code.
- Applications running on other AWS services, such as EC2 or ECS, install the X-Ray agent and instrument the application code
- CloudWatch Agent can now collect and send traces to X-Ray using the OpenTelemetry Protocol (OTLP), providing a unified agent for metrics, logs, and traces.
X-Ray Core Concepts
- Segment
- A Segment encapsulates all the data points for a single component of the distributed application for e.g. authorization component.
- A segment provides the resource’s name, details about the request, and details about the work done.
- Segments include system-defined and user-defined data in the form of annotations and are composed of one or more sub-segments that represent remote calls made from the service. for e.g. database call and its result within the overall request/response
- Subsegments
- A segment can break down the data about the work done into subsegments.
- Subsegments provide more granular timing information and details about downstream calls that the application made to fulfill the original request.
- A subsegment can contain additional details about a call to an AWS service, an external HTTP API, or an SQL database.
- Arbitrary subsegments can be defined to instrument specific functions or lines of code in the application.
- Trace
- Trace collects all the segments generated by a single request.
- Trace is a set of data points that share the same trace ID.
- Trace helps track the request, which is assigned a unique trace id, while it navigates through services
- Piece of information relayed by each service in the application to X-Ray is a segment, and a trace is a collection of segments.
- Filter Expressions
- Filter expressions can be used to find traces related to specific paths or users.
- Annotations and Metadata
- Annotations are simple key-value pairs that are indexed for use with filter expressions.
- Metadata are key-value pairs with values of any type, including objects and lists, but that is not indexed.
- An Annotation is system-defined or user-defined data
- System-defined annotations include data added to the segment by AWS services
- User-defined annotations are metadata added to a segment by a developer
- Annotations and metadata are aggregated at the trace level and can be added to any segment or subsegment.
- Annotation and metadata are associated with a segment and a segment can contain multiple annotations.
- Errors, Faults, and Exceptions
- X-Ray errors are system annotations associated with a segment for a call that results in an error response.
- Error includes the error message, stack trace, and any additional information for e.g, version to associate the error with a source file.
- Error – Client errors (400 series errors)
- Fault – Server faults (500 series errors)
- Throttle – Throttling errors (429 Too Many Requests)
- Sampling
- X-Ray collects data for a significant number of requests, instead of each request sent to an application, for performant and cost-effectiveness
- X-Ray should not be used as an audit or compliance tool because it does not guarantee data completeness.
- By default, the X-Ray SDK records the first request each second, and five percent of any additional requests.
- Sampling rules can be configured centrally in the X-Ray console or API without redeploying applications. Rules can match on service name, HTTP method, URL path, resource ARN, and other attributes.
- Both ADOT and X-Ray SDK honor centrally configured sampling rules from the X-Ray service.
- Groups
- Groups are collections of traces defined by a filter expression.
- Groups can be used to generate additional service graphs and supply Amazon CloudWatch metrics.
- Groups enable focused analysis of specific services, environments, or request patterns.
X-Ray Insights
- X-Ray Insights continuously analyzes trace data to identify emergent issues in applications using anomaly detection.
- When fault rates exceed the expected range, X-Ray creates an insight that records the issue and tracks its impact until resolved.
- Insights capabilities:
- Identify where issues are occurring, root cause, and associated impact
- Impact analysis to derive severity and priority
- Receive notifications as issues change over time via Amazon EventBridge
- Automate alerts based on issue severity
- X-Ray uses statistical modeling to predict expected fault rates and detects anomalies in nodes of the service map.
- Insights must be enabled per group in X-Ray settings.
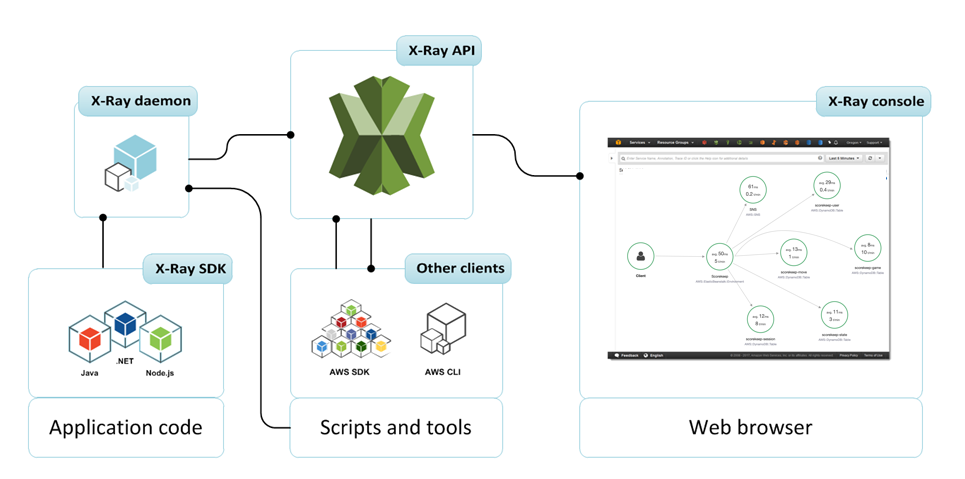
X-Ray Daemon
- X-Ray daemon is a software application that listens for traffic on UDP port 2000, gathers raw segment data, and relays it to the AWS X-Ray API.
- Daemon works in conjunction with the AWS X-Ray SDKs and must be running so that data sent by the SDKs can reach the X-Ray service.
- Note: As of February 25, 2026, the X-Ray Daemon is in maintenance mode. AWS recommends migrating to the CloudWatch Agent or ADOT Collector for trace collection.
X-Ray API
- X-Ray API provides access to all X-Ray functionality through the AWS SDK, AWS Command Line Interface, or directly over HTTPS.
X-Ray with VPC Endpoints
- X-Ray can be configured to use an Interface VPC endpoint, that enables you to privately access X-Ray APIs through private IP addresses.
- AWS PrivateLink restricts all network traffic between the VPC and X-Ray to the Amazon network. You don’t need an internet gateway, a NAT device, or a virtual private gateway.
OpenTelemetry and X-Ray
- AWS X-Ray has transitioned to OpenTelemetry (OTel) as its primary instrumentation standard for application tracing.
- OpenTelemetry is an industry-wide open-source standard (CNCF project) providing standardized protocols and tools for collecting and routing telemetry data.
- AWS Distro for OpenTelemetry (ADOT)
- AWS’s distribution of OpenTelemetry for collecting metrics, traces, and logs.
- Supports auto-instrumentation (zero-code) for Java, Python, Node.js, .NET, and Go.
- Traces collected via ADOT are sent to X-Ray backend for visualization and analysis.
- Provides broader library/framework coverage than X-Ray SDKs.
- X-Ray OTLP Endpoint
- Customers can send traces directly to X-Ray using the OpenTelemetry Protocol (OTLP) without needing the X-Ray Daemon.
- Enables use of any OTLP-compatible exporter to send traces to X-Ray.
- Required when using CloudWatch Transaction Search features.
- CloudWatch Agent for Traces
- The unified CloudWatch Agent can now collect traces via OTLP and forward them to X-Ray.
- Provides a single agent for metrics, logs, and traces collection.
- Migration Benefits:
- Zero-code auto-instrumentation (no code changes needed)
- Broader language and framework support
- Industry-standard APIs portable across observability backends
- Access to CloudWatch Application Signals and Transaction Search
CloudWatch Integration
- CloudWatch ServiceLens
- Brings together metrics, logs, and X-Ray traces into a unified service map view.
- Correlates trace data with CloudWatch metrics and logs for faster troubleshooting.
- Provides drill-down from service map nodes to specific traces, metrics, and log groups.
- CloudWatch Application Signals (GA June 2024)
- Application Performance Monitoring (APM) solution built on X-Ray traces and OpenTelemetry.
- Provides pre-built dashboards showing volume, availability, latency, faults, and errors.
- Supports Service Level Objectives (SLOs) to track application performance against KPIs.
- Automatic instrumentation across ECS, EKS, Lambda, EC2, and App Runner.
- Supports Java, Python, Node.js, and .NET applications.
- CloudWatch Transaction Search (Launched November 2024)
- Interactive analytics experience for complete visibility into application transaction spans.
- Enables searching and analyzing spans across all traces without sampling limitations.
- Bundles X-Ray tracing capabilities with Application Signals features under a unified pricing model.
- Supports spans sent via X-Ray SDK, ADOT, or OTLP endpoint.
- CloudWatch RUM (Real-User Monitoring)
- Integrates with X-Ray to analyze and debug the request path from end users through downstream services.
AWS Certification Exam Practice Questions
- Questions are collected from Internet and the answers are marked as per my knowledge and understanding (which might differ with yours).
- AWS services are updated everyday and both the answers and questions might be outdated soon, so research accordingly.
- AWS exam questions are not updated to keep up the pace with AWS updates, so even if the underlying feature has changed the question might not be updated
- Open to further feedback, discussion and correction.
- A company is facing performance issues with their microservices architecture deployed on AWS. Which service can help them debug and analyze the issue? [CCP]
- AWS Inspector
- CodeDeploy
- X-Ray
- AWS Config
- A development team wants to instrument their distributed application for tracing with AWS X-Ray. Which approach does AWS currently recommend? [DVA-C02]
- Install the X-Ray SDK and X-Ray Daemon on each service instance
- Use AWS Distro for OpenTelemetry (ADOT) with auto-instrumentation
- Write custom segments directly to the X-Ray API
- Use CloudWatch Logs Insights to trace requests
- A developer needs to add custom metadata to X-Ray traces that can be used to filter and search traces later. Which X-Ray concept should they use? [DVA-C02]
- Metadata key-value pairs
- Subsegments
- Annotations
- Groups
- A company wants a unified view that correlates application traces, CloudWatch metrics, and logs to troubleshoot issues in their distributed application. Which AWS feature provides this capability? [SOA-C02]
- X-Ray Trace Map
- CloudWatch Dashboards
- CloudWatch ServiceLens
- X-Ray Insights
- A team wants to be automatically notified when their application experiences an increase in fault rates. They are using AWS X-Ray for tracing. Which X-Ray feature, combined with which AWS service, provides proactive anomaly detection and notifications? [SOA-C02]
- X-Ray Groups with CloudWatch Alarms
- X-Ray Insights with Amazon EventBridge
- X-Ray Sampling Rules with SNS
- X-Ray Trace Map with CloudWatch Logs
- An organization is migrating from X-Ray SDK instrumentation. They want zero-code auto-instrumentation with the ability to send traces to X-Ray and also use CloudWatch Application Signals. Which solution meets these requirements? [DVA-C02]
- Install the X-Ray Daemon and configure it to forward to CloudWatch
- Use the CloudWatch Logs agent with X-Ray integration
- Deploy AWS Distro for OpenTelemetry (ADOT) auto-instrumentation agent
- Configure the application to write traces directly to the X-Ray API