AWS EC2 EBS Monitoring

EBS Monitoring

AWS supports EBS monitoring by automatically providing data, such as CloudWatch metrics and volume status checks to help monitor EBS volumes.

CloudWatch Monitoring

  • CloudWatch metrics are statistical data that you can use to view, analyze, and set alarms on the operational behavior of the EBS volumes.
  • All Amazon EBS volume types automatically send 1-minute metrics to CloudWatch at no additional charge, but only when the volume is attached to an instance.
  • Some metrics have differences on Nitro-based instances vs. Xen-based instances.
  • EBS Metrics (AWS/EBS namespace)
    • VolumeReadBytes & VolumeWriteBytes
      • Provides information on the I/O operations in a specified period of time, in bytes.
    • VolumeReadOps & VolumeWriteOps
      • Total number (count) of I/O operations in a specified period of time.
    • VolumeTotalReadTime & VolumeTotalWriteTime
      • Total number of seconds spent by all operations that were completed in a specified period of time.
      • For Xen instances, data is reported only when there is read/write activity on the volume.
    • VolumeIdleTime
      • Total number of seconds, in a specific period, when the volume was idle (no read and write operations).
    • VolumeQueueLength
      • Number of read and write operations, in a specific period, waiting to be completed.
    • VolumeThroughputPercentage (Provisioned IOPS SSD volumes only)
      • Percentage of I/O operations per second (IOPS) delivered of the total IOPS provisioned.
    • VolumeConsumedReadWriteOps (Provisioned IOPS SSD volumes only)
      • Total amount of read and write operations (normalized to 256K capacity units) consumed in a specified period of time.
    • BurstBalance (gp2, st1, and sc1 volumes only)
      • Percentage of I/O credits (for gp2) or throughput credits (for st1 and sc1) remaining in the burst bucket.
      • Data is reported only when the volume is active. If the baseline performance exceeds the maximum burst performance, credits are never spent and burst balance remains at 100%.

I/O Latency Metrics (Nitro Instances Only – Added Oct 2024)

  • VolumeReadLatency
    • The per-minute average read I/O latency for the EBS volume, in milliseconds.
  • VolumeWriteLatency
    • The per-minute average write I/O latency for the EBS volume, in milliseconds.
  • Available at 1-minute granularity at no additional charge for all EBS volumes attached to EC2 Nitro instances.
  • Helps identify if latency is a result of under-provisioned EBS volumes.

Performance Exceeded Check Metrics (Nitro Instances Only – Added Oct 2024)

  • VolumeIOPSExceededCheck
    • Reports whether an application consistently attempted to drive IOPS that exceeds the volume’s provisioned IOPS performance within the last minute.
    • Returns 0 (not exceeded) or 1 (exceeded).
  • VolumeThroughputExceededCheck
    • Reports whether an application consistently attempted to drive throughput that exceeds the volume’s provisioned throughput performance within the last minute.
    • Returns 0 (not exceeded) or 1 (exceeded).
  • Supported for all volume types except magnetic (standard) attached to Nitro instances.
  • Not supported with Multi-Attach enabled volumes.

Average Performance Metrics (Nitro Instances Only – Added Oct 2025)

  • VolumeAvgIOPS
    • The average read and write IOPS driven to the volume in a minute.
    • Returns zero if no operations were driven to the volume within the last minute.
  • VolumeAvgThroughput
    • The average read and write throughput (KiB/s) driven to the volume in a minute.
    • Returns zero if no operations were driven to the volume within the last minute.
  • Useful for tracking performance trends, detecting bottlenecks, and right-sizing provisioned performance.

Instance-Level EBS Metrics (AWS/EC2 Namespace – Nitro Instances)

  • InstanceEBSIOPSExceededCheck (Added Oct 2025)
    • Reports whether driven IOPS is exceeding the maximum EBS IOPS that the instance can support within the last minute.
    • Returns 0 (not exceeded) or 1 (exceeded).
  • InstanceEBSThroughputExceededCheck (Added Oct 2025)
    • Reports whether driven throughput is exceeding the maximum EBS throughput limits for the instance within the last minute.
    • Returns 0 (not exceeded) or 1 (exceeded).
  • EBSReadOps & EBSWriteOps
    • Completed read/write operations from all EBS volumes attached to the instance.
  • EBSIOBalance% & EBSByteBalance%
    • Percentage of I/O credits and throughput credits remaining for burst-capable instances.
    • Available for instances that burst to their maximum performance for 30 minutes at least once every 24 hours.

CloudWatch Agent – EBS Detailed Performance Statistics (Added Jun 2025)

  • The CloudWatch agent can collect NVMe-based detailed performance statistics from EBS volumes attached to Nitro instances.
  • Metrics include queue depth, number of operations, bytes sent and received, and time spent on read and write I/O operations.
  • Available at sub-minute granularity as custom metrics in CloudWatch.
  • Provides deeper visibility beyond standard CloudWatch metrics for performance-sensitive workloads.

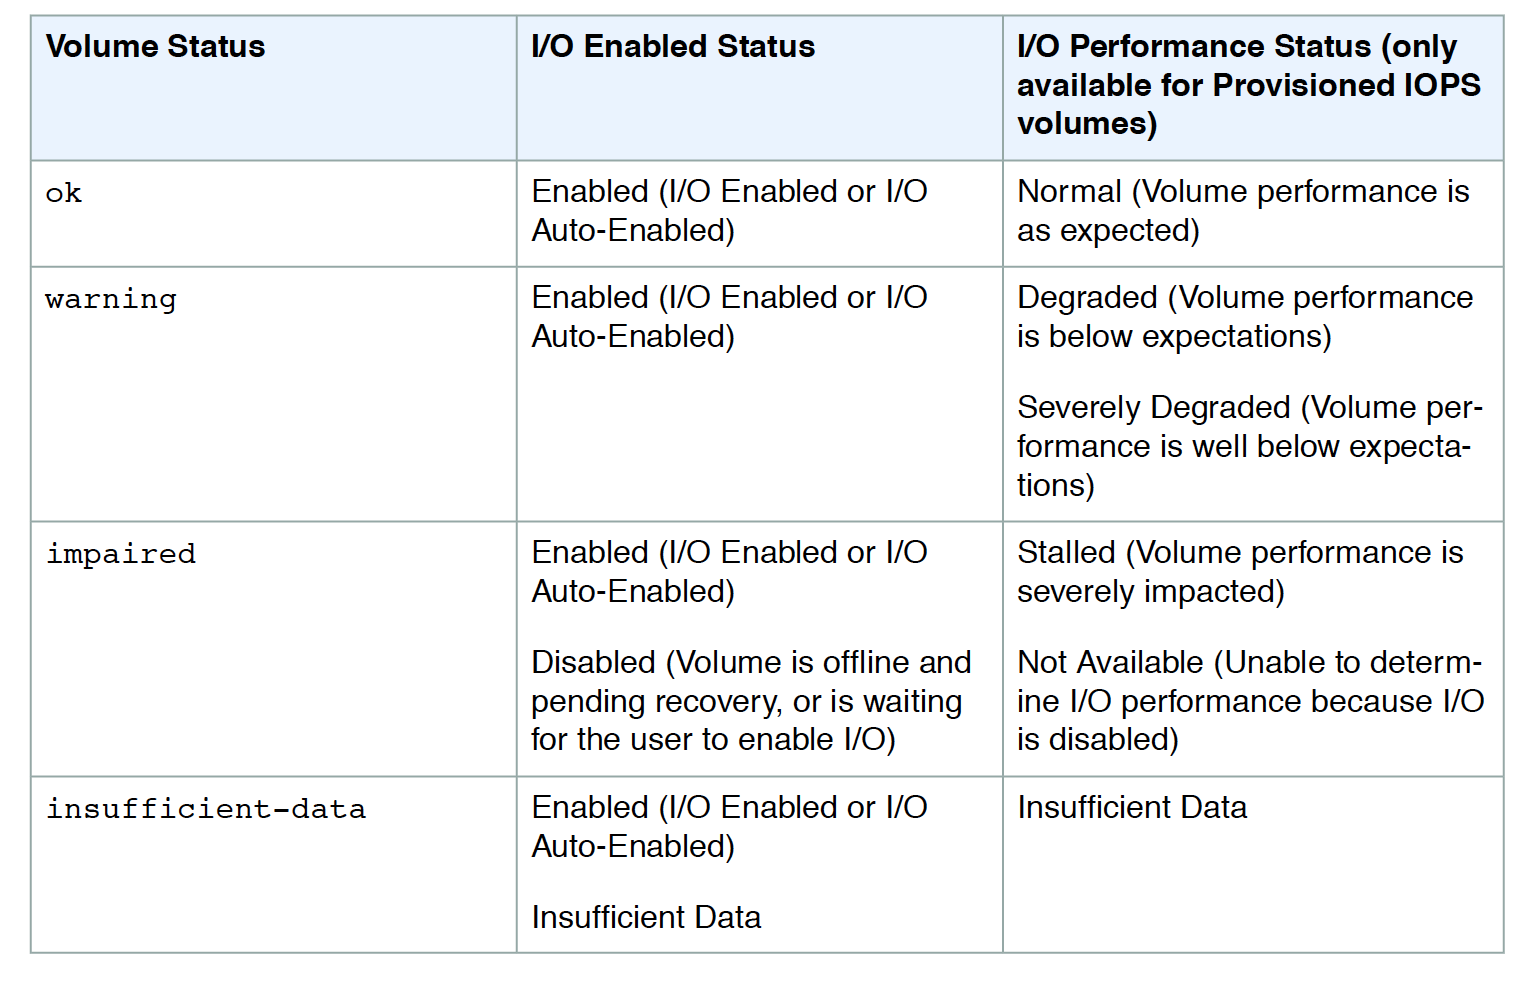
Volume Status Checks Monitoring

EC2 EBS Volume Status Check Monitoring

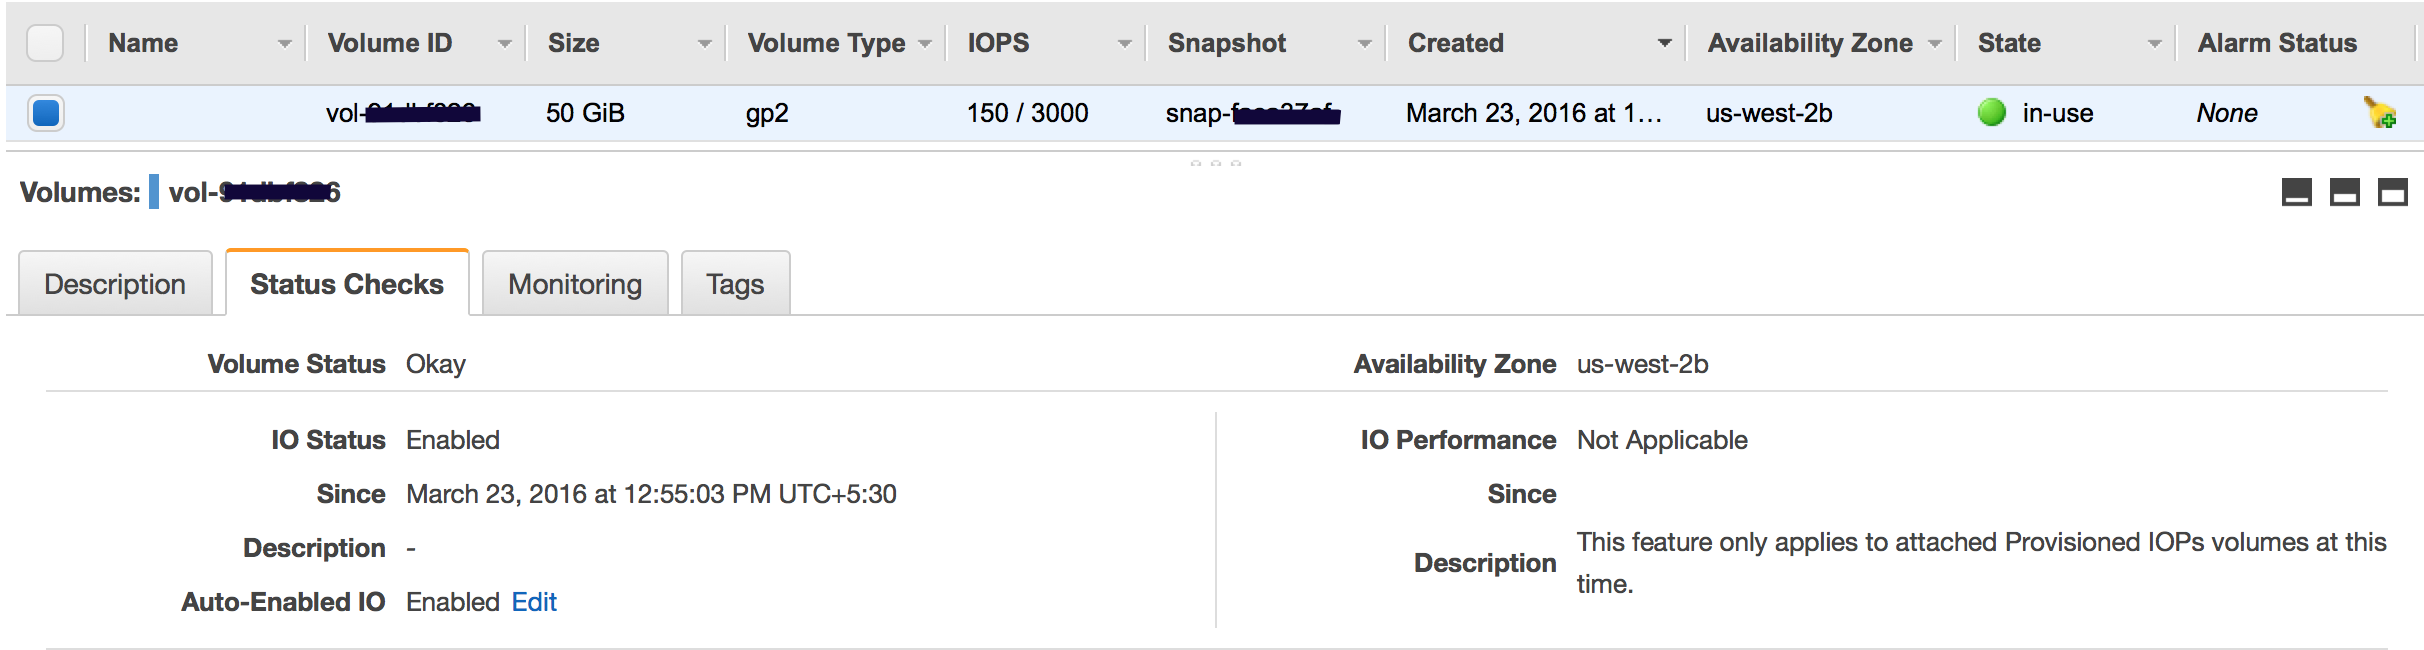
  • Volume status checks are automated tests that run every 5 minutes and return a pass or fail status.
  • Volume check status
    • Ok – all the status checks passed
    • Impaired – if the status checks failed
    • Insufficient-Data – checks are still in progress
    • Warning – the I/O performance of the volume is below expectations
  • When EBS determines the volume’s data is potentially inconsistent, it disables the I/O to the EBS volume from the attached EC2 instance to prevent any data corruption. This leads to the status check to fail and the volume status being impaired. Amazon waits for the I/O to be enabled, giving you an opportunity to perform consistency checks.
  • If the auto disabling of I/O is not needed, it can be overridden by enabling the Auto-Enabled IO flag, which would make the EBS volume auto-available immediately after the impaired status.
  • Events would be fired for notification whenever the I/O for an EBS volume is disabled.
  • I/O performance status checks compare actual volume performance with the expected volume performance and alert if performing below expectations. Applicable to io1, io2, and gp3 volumes.
  • While initializing Provisioned IOPS (SSD) volumes that were restored from snapshots, the performance of the volume may drop below 50 percent of its expected level, which causes the volume to display a warning state in the I/O Performance status check. This is expected and can be ignored.

EC2 EBS Volume Status

Attached EBS Status Checks (Added Aug 2024)

  • Amazon EC2 now includes a third type of status check — Attached EBS Status Check — that monitors whether the EBS volumes attached to an instance are reachable and can complete I/O operations.
  • The CloudWatch metric StatusCheckFailed_AttachedEBS reports a binary value:
    • 0 – All attached EBS volumes are reachable and can complete I/O.
    • 1 – One or more attached EBS volumes are impaired and unable to complete I/O operations.
  • Available for Nitro-based EC2 instances.
  • Enables creating CloudWatch alarms to automatically detect and respond to EBS volume reachability issues at the instance level.
  • Three types of EC2 status checks now exist:
    • System status checks – monitor the AWS systems the instance runs on.
    • Instance status checks – monitor the instance’s software and network configuration.
    • Attached EBS status checks – monitor reachability of attached EBS volumes.

Volume Initialization Status Monitoring (Added Jul 2025)

  • EBS now provides visibility into volume initialization status for volumes created from snapshots.
  • Allows you to validate when all blocks have been downloaded and written to the volume, enabling fully provisioned performance.
  • Can be used to time application launches to align with volume initialization completion.
  • EBS also supports Provisioned Rate for Volume Initialization (Added May 2025) that allows specifying a volume initialization rate between 100-300 MiB/s for faster initialization of snapshot-restored volumes.
  • EventBridge events are published for volume initialization state changes.

Volume Events Monitoring

  • EBS sends events to Amazon EventBridge for volume status changes and actions performed on volumes and snapshots.
  • Each event includes a start time that indicates the time at which the event occurred and a duration that indicates how long I/O for the volume was disabled.
  • Events description can be:
    • Awaiting Action: Enable IO – Volume data is potentially inconsistent, I/O is disabled.
    • IO Enabled – I/O operations were explicitly enabled for this volume.
    • IO Auto-Enabled – I/O operations were automatically enabled on this volume after an event.
    • Normal – For io1, io2, and gp3 volumes only. Volume performance is as expected.
    • Degraded – For io1, io2, and gp3 volumes only. Volume performance is below expectations.
    • Severely Degraded or Stalled – Volume performance significantly impacted.
  • EventBridge rules can trigger programmatic actions in response to these events (e.g., send notifications, invoke Lambda functions).

AWS Certification Exam Practice Questions

  • Questions are collected from Internet and the answers are marked as per my knowledge and understanding (which might differ with yours).
  • AWS services are updated everyday and both the answers and questions might be outdated soon, so research accordingly.
  • AWS exam questions are not updated to keep up the pace with AWS updates, so even if the underlying feature has changed the question might not be updated
  • Open to further feedback, discussion and correction.
  1. A user has configured CloudWatch monitoring on an EBS backed EC2 instance. If the user has not attached any additional device, which of the below mentioned metrics will always show a 0 value?
    1. DiskReadBytes
    2. NetworkIn
    3. NetworkOut
    4. CPUUtilization
  2. What does it mean if you have zero IOPS and a non-empty I/O queue for all EBS volumes attached to a running EC2 instance?
    1. The I/O queue is buffer flushing.
    2. Your EBS disk head(s) is/are seeking magnetic stripes.
    3. The EBS volume is unavailable. (EBS volumes are unavailable when all of the attached volumes perform zero read write IO, with pending IO in the queue. Refer link)
    4. You need to re-mount the EBS volume in the OS.
  3. While performing the volume status checks, if the status is insufficient-data, what does it mean?
    1. checks may still be in progress on the volume
    2. check has passed
    3. check has failed
  4. An application running on an EC2 instance with an io2 EBS volume is experiencing intermittent latency spikes. Which NEW CloudWatch metrics should be used to identify if the volume is under-provisioned? (Choose 2)
    1. VolumeReadLatency and VolumeWriteLatency
    2. VolumeQueueLength
    3. VolumeIOPSExceededCheck
    4. VolumeIdleTime
    5. VolumeTotalReadTime
  5. A company wants to monitor whether EBS volume performance bottlenecks are caused by the volume limits or the EC2 instance limits. Which combination of metrics should be used?
    1. VolumeReadOps and VolumeWriteOps
    2. BurstBalance and VolumeQueueLength
    3. VolumeIOPSExceededCheck (volume-level) and InstanceEBSIOPSExceededCheck (instance-level)
    4. EBSIOBalance% and VolumeThroughputPercentage
  6. After the August 2024 update, how many types of EC2 status checks are available?
    1. One – System status check
    2. Two – System and Instance status checks
    3. Three – System, Instance, and Attached EBS status checks
    4. Four – System, Instance, EBS Volume, and Network status checks

References

CloudWatch Monitoring Supported AWS Services

CloudWatch Monitoring Supported AWS Services

  • CloudWatch offers either basic or detailed monitoring for supported AWS services.
  • Basic monitoring means that a service sends data points to CloudWatch every five minutes.
  • Detailed monitoring means that a service sends data points to CloudWatch every minute.
  • If the AWS service supports both basic and detailed monitoring, the basic would be enabled by default and the detailed monitoring needs to be enabled for detailed metrics.
  • High-Resolution Custom Metrics allow publishing data at 1-second resolution using the PutMetricData API with a StorageResolution of 1.

Monitoring Categories

  • Basic Monitoring – Free, default set of metrics published at 5-minute intervals for most services.
  • Detailed Monitoring – Paid, more frequent metrics (typically 1-minute intervals). Must be explicitly enabled.
  • High-Resolution Custom Metrics – Custom metrics published at up to 1-second intervals using PutMetricData API or Embedded Metric Format (EMF).

Services Offering Detailed Monitoring

The following services officially offer detailed monitoring (paid, more fine-grained metrics):

  • Amazon API Gateway – Additional dimensions for detailed metrics
  • AWS AppSync – Detailed CloudWatch metrics
  • Amazon CloudFront – Additional distribution metrics
  • Amazon EC2 – 1-minute metrics (vs. 5-minute basic)
  • AWS Elastic Beanstalk – Enhanced health reporting and monitoring
  • Amazon Kinesis Data Streams – Enhanced shard-level metrics
  • AWS Lambda – Event source mapping metrics
  • Amazon Managed Streaming for Apache Kafka (MSK) – Per-broker, per-topic metrics
  • Amazon S3 – Request metrics at 1-minute intervals
  • Amazon SES – Detailed monitoring via event publishing

AWS Services with Monitoring Support

  • Auto Scaling
    • By default, basic monitoring is enabled when the launch configuration is created using the AWS Management Console, and detailed monitoring is enabled when the launch configuration is created using the AWS CLI or an API.
    • Auto Scaling sends data to CloudWatch every 5 minutes by default when created from Console.
    • For an additional charge, you can enable detailed monitoring for Auto Scaling, which sends data to CloudWatch every minute.
  • Amazon CloudFront
    • Amazon CloudFront sends data to CloudWatch every minute by default.
    • Additional distribution metrics (detailed monitoring) can be enabled for more fine-grained visibility.
  • Amazon CloudSearch
    • Amazon CloudSearch sends data to CloudWatch every minute by default.
  • Amazon EventBridge (formerly Amazon CloudWatch Events)
    • Amazon EventBridge sends data to CloudWatch every minute by default.
  • Amazon CloudWatch Logs
    • Amazon CloudWatch Logs sends data to CloudWatch every minute by default.
  • Amazon DynamoDB
    • Amazon DynamoDB sends data to CloudWatch every minute for some metrics and every 5 minutes for other metrics.
    • DynamoDB Contributor Insights provides additional metrics for table and global secondary index access patterns.
  • Amazon Elastic Container Service (Amazon ECS)
    • Amazon ECS sends data to CloudWatch every minute.
    • Container Insights provides additional detailed metrics at the cluster, service, task, and container level including CPU, memory, network, and storage metrics.
  • Amazon ElastiCache
    • Amazon ElastiCache sends data to CloudWatch every minute.
  • Amazon Elastic Block Store (EBS)
    • Amazon EBS sends data to CloudWatch every 5 minutes for gp2, st1, and sc1 volumes.
    • Provisioned IOPS SSD (io1 and io2) volumes automatically send one-minute metrics to CloudWatch.
    • gp3 volumes also send metrics at 1-minute intervals.
  • Amazon Elastic Compute Cloud (EC2)
    • Amazon EC2 sends data to CloudWatch every 5 minutes by default. For an additional charge, you can enable detailed monitoring for Amazon EC2, which sends data to CloudWatch every minute.
  • Elastic Load Balancing
    • Elastic Load Balancing sends data to CloudWatch every minute (applies to ALB, NLB, GLB, and Classic Load Balancer).
  • Amazon EMR (formerly Amazon Elastic MapReduce)
    • Amazon EMR sends basic data to CloudWatch every 5 minutes by default at no additional cost.
    • Starting with Amazon EMR Release 7.0+, the CloudWatch Agent can publish 34 enhanced metrics every minute (additional charges apply).
    • EMR Serverless sends metrics to CloudWatch every minute.
  • Amazon OpenSearch Service (formerly Amazon Elasticsearch Service)
    • Amazon OpenSearch Service sends data to CloudWatch every minute.
  • Amazon Kinesis Data Streams (formerly Amazon Kinesis Streams)
    • Amazon Kinesis Data Streams sends stream-level data to CloudWatch every minute.
    • Enhanced shard-level metrics (detailed monitoring) provide additional per-shard metrics.
  • Amazon Data Firehose (formerly Amazon Kinesis Data Firehose)
    • Amazon Data Firehose sends data to CloudWatch every minute.
  • AWS Lambda
    • AWS Lambda sends data to CloudWatch every minute.
    • Lambda Insights provides enhanced monitoring with system-level metrics (CPU, memory, network) at 1-minute intervals.
  • Amazon SageMaker AI
    • Amazon SageMaker AI (which replaced the legacy Amazon Machine Learning service) sends training, endpoint, and transform job metrics to CloudWatch every minute.
  • ⚠️ Note: The original Amazon Machine Learning service is no longer accepting new users. AWS recommends using Amazon SageMaker AI for machine learning workloads.
  • Amazon Redshift
    • Amazon Redshift sends data to CloudWatch every minute.
  • Amazon Relational Database Service (RDS)
    • Amazon RDS sends data to CloudWatch every minute.
    • CloudWatch Database Insights (launched Dec 2024) provides comprehensive database observability with fleet-level and instance-level dashboards.
  • Amazon Route 53
    • Amazon Route 53 sends data to CloudWatch every minute.
  • Amazon Simple Notification Service (SNS)
    • Amazon SNS sends data to CloudWatch every 5 minutes.
    • SNS does not support detailed (1-minute) monitoring.
  • Amazon Simple Queue Service (SQS)
    • Amazon SQS sends data to CloudWatch every 5 minutes.
  • Amazon Simple Storage Service (S3)
    • Amazon S3 sends storage metrics (bucket size, object count) to CloudWatch once a day (basic monitoring, free).
    • Request metrics (detailed monitoring) are available at 1-minute intervals and are billed as CloudWatch custom metrics.
    • 1-minute metrics are available at the bucket-level by default when request metrics are enabled.
  • Amazon Simple Workflow Service (SWF)
    • Amazon SWF sends data to CloudWatch every 5 minutes.
    • Note: AWS Step Functions is the recommended alternative for new workflow orchestration workloads.
  • AWS Storage Gateway
    • AWS Storage Gateway sends data to CloudWatch every 5 minutes.
  • AWS WAF
    • AWS WAF sends data to CloudWatch every minute.
  • Amazon WorkSpaces
    • Amazon WorkSpaces sends data to CloudWatch every 5 minutes.

⚠️ AWS OpsWorks – End of Life

AWS OpsWorks reached End of Life (EOL) on May 26, 2024. The service has been disabled for both new and existing customers. The OpsWorks console, API, CLI, and CloudFormation resources are no longer available.

Alternatives: AWS Systems Manager, AWS CodeDeploy, AWS CloudFormation

Additional Services Publishing CloudWatch Metrics (2024-2026)

The following additional AWS services publish metrics to CloudWatch (not in the original list):

  • Amazon API Gateway – Sends metrics every minute
  • AWS AppSync – Sends metrics every minute
  • Amazon EKS – Control plane metrics and Container Insights
  • Amazon Bedrock – Model invocation and throughput metrics
  • AWS Step Functions – Execution metrics every minute
  • Amazon Aurora – Database metrics every minute (with Database Insights)
  • AWS Fargate – Container-level metrics via Container Insights
  • Amazon MSK – Streaming metrics with per-broker/topic detail
  • AWS Network Firewall – Firewall metrics every minute
  • Amazon MemoryDB – Database metrics every minute

CloudWatch Enhanced Observability Features

  • Container Insights – Collects and aggregates metrics and logs from containerized applications on Amazon ECS, Amazon EKS, and Kubernetes. Provides cluster, node, pod, task, and service level metrics.
  • Lambda Insights – Enhanced monitoring for Lambda functions with system-level metrics (CPU, memory, network, disk).
  • Database Insights (Dec 2024) – Comprehensive database observability for Amazon RDS and Aurora with fleet-level health monitoring and instance-level SQL query analysis.
  • Application Signals (June 2024) – Application performance monitoring (APM) with pre-built dashboards showing volume, availability, latency, faults, and errors.
  • Internet Monitor – Near-continuous internet measurements for availability and performance, tailored to your workload footprint on AWS.
  • CloudWatch Investigations – AI-powered investigation of operational issues across services.

AWS Certification Exam Practice Questions

  • Questions are collected from Internet and the answers are marked as per my knowledge and understanding (which might differ with yours).
  • AWS services are updated everyday and both the answers and questions might be outdated soon, so research accordingly.
  • AWS exam questions are not updated to keep up the pace with AWS updates, so even if the underlying feature has changed the question might not be updated
  • Open to further feedback, discussion and correction.
  1. What is the minimum time interval for the data that Amazon CloudWatch receives and aggregates?
    1. One second (High-resolution custom metrics support 1-second resolution)
    2. Five seconds
    3. One minute
    4. Three minutes
    5. Five minutes

    Note: The original answer was “One minute” which was correct for standard metrics. With high-resolution custom metrics (introduced 2017), CloudWatch supports 1-second resolution. Exam questions may still reference 1 minute as the minimum for AWS service metrics.

  2. In the ‘Detailed’ monitoring data available for your Amazon EBS volumes, Provisioned IOPS volumes automatically send _____ minute metrics to Amazon CloudWatch.
    1. 3
    2. 1
    3. 5
    4. 2
  3. Using Amazon CloudWatch’s Free Tier, what is the frequency of metric updates, which you receive?
    1. 5 minutes
    2. 500 milliseconds.
    3. 30 seconds
    4. 1 minute
  4. What is the type of monitoring data (for Amazon EBS volumes) which is available automatically in 5-minute periods at no charge called?
    1. Basic
    2. Primary
    3. Detailed
    4. Local
  5. A user has created an Auto Scaling group using CLI. The user wants to enable CloudWatch detailed monitoring for that group. How can the user configure this?
    1. When the user sets an alarm on the Auto Scaling group, it automatically enables detail monitoring
    2. By default detailed monitoring is enabled for Auto Scaling (Detailed monitoring is enabled when you create the launch configuration using the AWS CLI or an API)
    3. Auto Scaling does not support detailed monitoring
    4. Enable detail monitoring from the AWS console
  6. A user is trying to understand the detailed CloudWatch monitoring concept. Which of the below mentioned services provides detailed monitoring with CloudWatch without charging the user extra?
    1. AWS Auto Scaling
    2. AWS Route 53
    3. AWS EMR
    4. AWS SNS
  7. A user is trying to understand the detailed CloudWatch monitoring concept. Which of the below mentioned services does not provide detailed monitoring with CloudWatch?
    1. AWS EMR (EMR sends basic metrics every 5 minutes by default; enhanced monitoring at 1-minute intervals is available starting with EMR 7.0+ via CloudWatch Agent)
    2. AWS RDS
    3. AWS ELB
    4. AWS Route53
  8. A user has enabled detailed CloudWatch monitoring with the AWS Simple Notification Service. Which of the below mentioned statements helps the user understand detailed monitoring better?
    1. SNS will send data every minute after configuration
    2. There is no need to enable since SNS provides data every minute
    3. AWS CloudWatch does not support monitoring for SNS
    4. SNS cannot provide data every minute
  9. A user has configured an Auto Scaling group with ELB. The user has enabled detailed CloudWatch monitoring on Auto Scaling. Which of the below mentioned statements will help the user understand the functionality better?
    1. It is not possible to setup detailed monitoring for Auto Scaling
    2. In this case, Auto Scaling will send data every minute and will charge the user extra
    3. Detailed monitoring will send data every minute without additional charges
    4. Auto Scaling sends data every minute only and does not charge the user
  10. Which of the following CloudWatch monitoring features provides near real-time visibility into application performance with pre-built dashboards?
    1. CloudWatch Logs Insights
    2. CloudWatch Alarms
    3. CloudWatch Application Signals
    4. CloudWatch Contributor Insights
  11. What is the minimum resolution supported by CloudWatch high-resolution custom metrics?
    1. 5 seconds
    2. 10 seconds
    3. 30 seconds
    4. 1 second
  12. Which CloudWatch feature provides comprehensive database observability with fleet-level health monitoring for Amazon RDS and Aurora?
    1. CloudWatch Logs Insights
    2. Enhanced Monitoring
    3. Performance Insights
    4. CloudWatch Database Insights

References

AWS ELB Monitoring

AWS ELB Monitoring

  • Elastic Load Balancing publishes data points to Amazon CloudWatch about the load balancers and targets (or back-end instances for Classic Load Balancer).
  • Elastic Load Balancing reports metrics to CloudWatch only when requests are flowing through the load balancer.
    • If there are requests flowing through the load balancer, Elastic Load Balancing measures and sends its metrics in 60-second intervals.
    • If there are no requests flowing through the load balancer or no data for a metric, the metric is not reported.
  • AWS provides four types of load balancers, each with its own monitoring capabilities:
    • Application Load Balancer (ALB) – Layer 7, HTTP/HTTPS/gRPC
    • Network Load Balancer (NLB) – Layer 4, TCP/UDP/TLS
    • Gateway Load Balancer (GWLB) – Layer 3, transparent network gateway
    • Classic Load Balancer (CLB) – Previous generation (Layer 4/7)
  • ELB monitoring options include CloudWatch metrics, access logs, connection logs, health check logs, CloudTrail logs, and CloudWatch Internet Monitor.

CloudWatch Metrics

Classic Load Balancer (CLB) Metrics

  • CLB metrics use the AWS/ELB namespace.
  • HealthyHostCount, UnHealthyHostCount
    • Number of healthy and unhealthy instances registered with the load balancer.
    • Most useful statistics are Average, Min, and Max.
  • RequestCount
    • Number of requests completed or connections made during the specified interval (1 or 5 minutes).
    • Most useful statistic is Sum.
  • Latency
    • Time elapsed, in seconds, after the request leaves the load balancer until the headers of the response are received.
    • Most useful statistic is Average.
  • SurgeQueueLength
    • Total number of requests that are pending routing.
    • Load balancer queues a request if it is unable to establish a connection with a healthy instance in order to route the request.
    • Maximum size of the queue is 1,024. Additional requests are rejected when the queue is full.
    • Most useful statistic is Max, because it represents the peak of queued requests.
  • SpilloverCount
    • The total number of requests that were rejected because the surge queue is full. Should ideally be 0.
    • Most useful statistic is Sum.
  • HTTPCode_ELB_4XX, HTTPCode_ELB_5XX
    • Client and server error codes generated by the load balancer.
    • Most useful statistic is Sum.
  • HTTPCode_Backend_2XX, HTTPCode_Backend_3XX, HTTPCode_Backend_4XX, HTTPCode_Backend_5XX
    • Number of HTTP response codes generated by registered instances.
    • Most useful statistic is Sum.

Application Load Balancer (ALB) Metrics

  • ALB metrics use the AWS/ApplicationELB namespace.
  • ActiveConnectionCount – Total concurrent TCP connections active from clients to the load balancer and from the load balancer to targets. Useful statistic: Sum.
  • NewConnectionCount – Total new TCP connections established from clients to the load balancer and from the load balancer to targets. Useful statistic: Sum.
  • RejectedConnectionCount – Number of connections rejected because the load balancer reached its maximum number of connections. Useful statistic: Sum.
  • RequestCount – Number of requests processed over IPv4 and IPv6. Useful statistic: Sum.
  • TargetResponseTime – Time elapsed after the request leaves the load balancer until the target starts to send response headers. Useful statistics: Average, pNN.NN (percentiles).
  • HealthyHostCount, UnHealthyHostCount – Number of healthy/unhealthy targets. Useful statistics: Average, Min, Max.
  • HTTPCode_Target_2XX_Count through 5XX_Count – HTTP response codes generated by targets. Useful statistic: Sum.
  • HTTPCode_ELB_4XX_Count, HTTPCode_ELB_5XX_Count – HTTP error codes generated by the load balancer itself. Useful statistic: Sum.
  • ClientTLSNegotiationErrorCount – TLS connections initiated by clients that did not establish a session with the load balancer. Useful statistic: Sum.
  • TargetConnectionErrorCount – Connections that were not successfully established between the load balancer and target. Useful statistic: Sum.
  • ProcessedBytes – Total bytes processed by the load balancer over IPv4 and IPv6. Useful statistic: Sum.
  • ConsumedLCUs – Number of Load Balancer Capacity Units (LCU) consumed. Used for billing calculations.
  • RuleEvaluations – Number of rules evaluated while processing requests.
  • AnomalousHostCount – Number of targets detected with anomalies (used with Automatic Target Weights). Useful statistics: Min, Max.

Network Load Balancer (NLB) Metrics

  • NLB metrics use the AWS/NetworkELB namespace.
  • ActiveFlowCount – Total number of concurrent flows (connections) from clients to targets. Useful statistic: Average.
  • NewFlowCount – Total number of new flows established from clients to targets. Useful statistic: Sum.
  • ProcessedBytes – Total bytes processed by the load balancer (TCP/TLS, UDP). Useful statistic: Sum.
  • TCP_Client_Reset_Count, TCP_Target_Reset_Count, TCP_ELB_Reset_Count – Number of reset (RST) packets sent from client, target, or the load balancer.
  • HealthyHostCount, UnHealthyHostCount – Number of healthy/unhealthy targets.
  • ConsumedLCUs – Number of Network Load Balancer Capacity Units consumed.
  • PeakBytesPerSecond – Highest average bytes per second for the load balancer during a period.

Gateway Load Balancer (GWLB) Metrics

  • GWLB metrics use the AWS/GatewayELB namespace.
  • ActiveFlowCount, NewFlowCount – Concurrent and new flows from clients to targets.
  • ProcessedBytes – Total bytes processed by the GWLB.
  • HealthyHostCount, UnHealthyHostCount – Number of healthy/unhealthy targets.
  • GWLB does NOT generate access logs since it is a transparent Layer 3 load balancer that does not terminate flows.

Elastic Load Balancer Access Logs

  • Elastic Load Balancing provides access logs that capture detailed information about all requests sent to the load balancer.
  • Each log contains information such as the time the request was received, the client’s IP address, latencies, request paths, and server responses.
  • Access logging is disabled by default and can be enabled without any additional charge. You are only charged for S3 storage.
  • Access logs are supported for ALB, NLB, and CLB. GWLB does not generate access logs.

ALB Access Logs

  • ALB publishes a log file for each load balancer node every 5 minutes to Amazon S3.
  • Log entries include: request type, timestamp, ELB name, client:port, target:port, request processing time, target processing time, response processing time, ELB/target status codes, received/sent bytes, request details, user agent, SSL cipher/protocol, target group ARN, trace ID, and more.

NLB Access Logs

  • NLB access logs capture information about TLS requests sent to the load balancer.
  • Logs can be stored in Amazon S3.
  • New (Nov 2025): NLB access logs now support delivery as CloudWatch Vended Logs, enabling direct delivery to CloudWatch Logs, Amazon Data Firehose, and Amazon S3 with Apache Parquet format support. This allows real-time log analysis using CloudWatch Logs Insights and Live Tail.

ALB Connection Logs

  • Connection logs capture detailed information about TLS connections established between clients and the ALB.
  • Useful for troubleshooting TLS client connection issues (e.g., mTLS failures, cipher mismatches).
  • Connection logs are stored in Amazon S3, with a log file published every 5 minutes.
  • This is an optional feature, disabled by default.
  • Log entries include: timestamp, client IP:port, listener port, TLS protocol/cipher, connection status, client certificate details (for mTLS), and more.

ALB Health Check Logs

  • New (Nov 2025): ALB now supports Health Check Logs that send detailed target health check data directly to a designated Amazon S3 bucket.
  • This optional feature captures:
    • Health check status (healthy/unhealthy)
    • Timestamps
    • Target identification data
    • Failure reasons for unhealthy targets
  • Health check logs are published every 5 minutes per load balancer node.
  • Helps troubleshoot intermittent target health check failures without needing to rely solely on CloudWatch metrics.
  • No additional charge; you pay only for S3 storage.

CloudWatch Internet Monitor

  • Amazon CloudWatch Internet Monitor provides internet performance and availability measurements for user traffic to load balancers.
  • Monitors internet traffic patterns and identifies issues that affect internet connectivity between users and AWS.
  • Supported for both ALB and NLB.
  • NLB integration (Sep 2024): You can create or associate a monitor for an NLB directly when creating it in the AWS Management Console.
  • Provides city-level visibility into performance impairments and their geographic scope.

CloudWatch Network Flow Monitor

  • New (Dec 2024, re:Invent): CloudWatch Network Flow Monitor offers network performance monitoring across AWS managed services.
  • Provides near real-time visibility into network performance for traffic between compute resources (EC2, EKS), to AWS services (S3, DynamoDB), and to other AWS Regions.
  • Uses lightweight agents to gather TCP connection performance statistics (packet loss, latency).
  • Can determine if AWS is the cause of a detected network issue for monitored flows.

ALB Automatic Target Weights (ATW)

  • New (Nov 2023): ALB supports Automatic Target Weights (ATW), which uses anomaly detection to optimize traffic routing.
  • ATW detects and mitigates gray failures — situations where a target passes health checks but still returns elevated errors.
  • Anomaly detection is automatically enabled on HTTP/HTTPS target groups with at least three healthy targets.
  • ATW analyzes HTTP return status codes and TCP/TLS errors to identify anomalous targets and reduces traffic to them.
  • Provides the AnomalousHostCount CloudWatch metric to monitor detected anomalies.

CloudWatch Anomaly Detection Alarms

  • CloudWatch anomaly detection uses machine learning to model expected metric behavior and automatically creates upper and lower bounds.
  • Can be used with ELB metrics like TargetResponseTime, RequestCount, HTTPCode_ELB_5XX to detect unusual patterns.
  • Recommended approach for monitoring ELB performance without manually setting static thresholds.
  • Works with ALB, NLB, CLB, and GWLB metrics.

CloudTrail Logs

  • AWS CloudTrail captures all API calls to the Elastic Load Balancing API made by or on behalf of your AWS account.
  • API calls can be made directly, or indirectly through the AWS Management Console, AWS CLI, or SDKs.
  • CloudTrail stores the information as log files in an Amazon S3 bucket.
  • Logs can be used to monitor load balancer activity and determine what API call was made, what source IP address was used, who made the call, when it was made, and so on.
  • Applies to all ELB types (ALB, NLB, GWLB, CLB).

Classic Load Balancer – Migration Recommendation

⚠️ Note: Classic Load Balancer is the previous generation load balancer. AWS strongly recommends migrating to Application Load Balancer (Layer 7) or Network Load Balancer (Layer 4).

EC2-Classic networking was fully retired in August 2023. While CLB continues to function in VPC, no new features are being added to it. Use the AWS Migration Wizard to move to ALB or NLB.

AWS Certification Exam Practice Questions

  • Questions are collected from Internet and the answers are marked as per my knowledge and understanding (which might differ with yours).
  • AWS services are updated everyday and both the answers and questions might be outdated soon, so research accordingly.
  • AWS exam questions are not updated to keep up the pace with AWS updates, so even if the underlying feature has changed the question might not be updated
  • Open to further feedback, discussion and correction.
  1. An admin is planning to monitor the ELB. Which of the below mentioned services does not help the admin capture the monitoring information about the ELB activity?
    1. ELB Access logs
    2. ELB health check
    3. CloudWatch metrics
    4. ELB API calls with CloudTrail
  2. A customer needs to capture all client connection information from their load balancer every five minutes. The company wants to use this data for analyzing traffic patterns and troubleshooting their applications. Which of the following options meets the customer requirements?
    1. Enable AWS CloudTrail for the load balancer.
    2. Enable access logs on the load balancer.
    3. Install the Amazon CloudWatch Logs agent on the load balancer.
    4. Enable Amazon CloudWatch metrics on the load balancer.
  3. Your supervisor has requested a way to analyze traffic patterns for your application. You need to capture all connection information from your load balancer every 10 minutes. Pick a solution from below. Choose the correct answer:
    1. Enable access logs on the load balancer.
    2. Create a custom metric CloudWatch filter on your load balancer.
    3. Use a CloudWatch Logs Agent.
    4. Use AWS CloudTrail with your load balancer.
  4. A company runs a web application behind an Application Load Balancer. Some users are experiencing intermittent 5XX errors but health checks show all targets as healthy. Which ALB feature can automatically detect and mitigate this issue?
    1. Cross-Zone Load Balancing
    2. Automatic Target Weights (ATW)
    3. Connection Draining
    4. Sticky Sessions
  5. A DevOps engineer needs to troubleshoot why targets behind an ALB are intermittently failing health checks. Which recently introduced feature provides detailed health check failure reasons stored in S3?
    1. ALB Access Logs
    2. CloudWatch HealthyHostCount metric
    3. ALB Health Check Logs
    4. AWS CloudTrail
  6. A solutions architect wants to analyze NLB access logs in near real-time using CloudWatch Logs Insights. Which delivery option should they configure?
    1. Enable NLB access logs to S3 and create Athena queries
    2. Configure NLB access logs as CloudWatch Vended Logs
    3. Enable VPC Flow Logs on the NLB
    4. Install CloudWatch Agent on NLB nodes
  7. Which of the following is a metric specific to Classic Load Balancer that indicates the load balancer cannot route requests because the queue is full?
    1. RejectedConnectionCount
    2. TargetConnectionErrorCount
    3. SpilloverCount
    4. HTTPCode_ELB_503
  8. A company wants to identify if AWS infrastructure is causing latency issues for users connecting to their Network Load Balancer from different geographic locations. Which service should they use?
    1. AWS X-Ray
    2. CloudWatch Metrics
    3. Amazon CloudWatch Internet Monitor
    4. VPC Flow Logs

References