Google Cloud Observability (formerly Operations Suite)
Google Cloud Observability (formerly known as Google Cloud Operations Suite) provides integrated monitoring, logging, and trace managed services for applications and systems running on Google Cloud and beyond. It is built on a “One Observability” foundation that unifies Cloud Logging, Cloud Monitoring, and Cloud Trace, providing a single pane of glass for the generation, collection, routing, storage, and consumption of telemetry at scale.
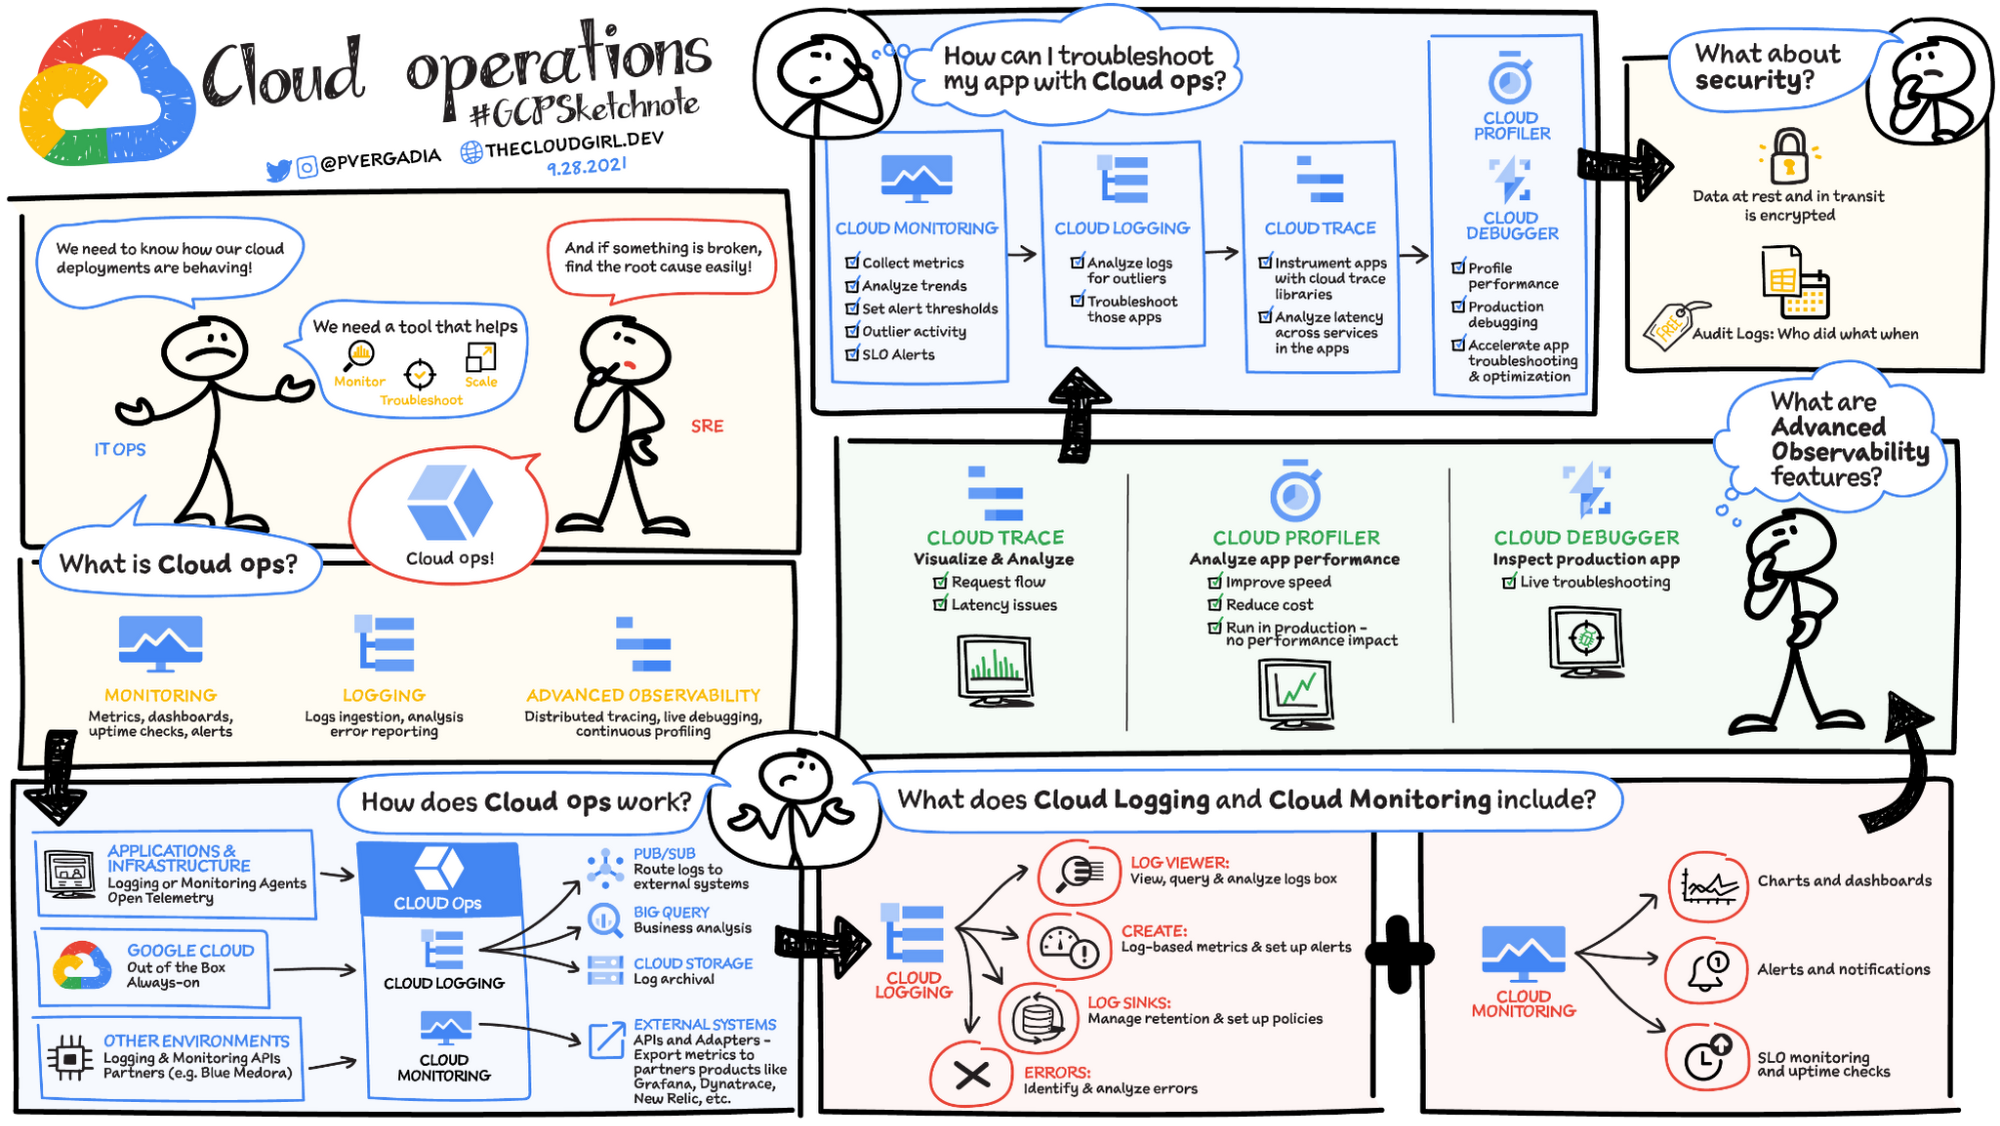
Cloud Monitoring
- Cloud Monitoring collects measurements of key aspects of the service and of the Google Cloud resources used.
- Cloud Monitoring provides tools to visualize and monitor this data.
- Cloud Monitoring helps gain visibility into the performance, availability, and health of the applications and infrastructure.
- Cloud Monitoring collects metrics, events, and metadata from Google Cloud, AWS, hosted uptime probes, and application instrumentation.
- Cloud Monitoring supports PromQL (Prometheus Query Language) for querying all metrics, including Google Cloud system metrics, Kubernetes metrics, custom metrics, and log-based metrics.
- Cloud Monitoring supports SLO Monitoring to define Service Level Objectives, track error budgets, and create alerting policies based on budget burn rate.
- Cloud Monitoring provides customizable observability dashboards available in GKE, Compute Engine, Cloud Run, Cloud Functions, Cloud Storage, and many other Google Cloud services.
Google Cloud Managed Service for Prometheus
- Google Cloud Managed Service for Prometheus lets you globally monitor and alert on workloads using Prometheus and OpenTelemetry, without having to manually manage and operate Prometheus at scale.
- It supports managed collection on GKE, Compute Engine, and Cloud Run.
- Prometheus metrics can be used with dashboarding, alerting, and SLO monitoring features inside Cloud Monitoring.
- It supports PromQL-based alerting policies alongside Cloud Monitoring metrics and dashboards.
- Grafana dashboards work natively with Managed Prometheus for visualization.
Cloud Logging
- Cloud Logging is a service for storing, viewing and interacting with logs.
- Answers the questions “Who did what, where and when” within the GCP projects.
- Maintains non-tamperable audit logs for each project and organization.
- Logs buckets are a regional resource, which means the infrastructure that stores, indexes, and searches the logs are located in a specific geographical location.
- Cloud Logging supports OTLP-formatted log ingestion using OpenTelemetry Collector and the Telemetry API.
- Cloud Logging supports log-based alerting policies to notify when specific messages appear in logs.
Log Analytics
- Log Analytics (GA since January 2023) brings capabilities to search, aggregate, or transform logs at query time directly within Cloud Logging.
- Log Analytics is powered by BigQuery, allowing SQL queries on log data without separate exports.
- Log Analytics supports pipe syntax (available since February 2025) for more intuitive querying.
- It enables security log analytics for auditing cloud usage and detecting potential threats using Community Security Analytics (CSA) queries.
- Log Analytics reduces costs and accelerates time to value compared to traditional BigQuery log exports.
Error Reporting
- Error Reporting aggregates and displays errors produced in the running cloud services.
- Error Reporting provides a centralized error management interface, to help find the application’s top or new errors so that they can be fixed faster.
- Error Reporting can analyze log entries routed to log buckets in non-global regions, provided the log sink is in the same project as the log bucket.
- Error Reporting supports Slack and webhook notifications for error alerts.
Cloud Profiler
- Cloud Profiler helps with continuous CPU, heap, and other parameters profiling to improve performance and reduce costs.
- Cloud Profiler is a continuous profiling tool that is designed for applications running on Google Cloud:
- It’s a statistical, or sampling, profiler that has low overhead and is suitable for production environments.
- It supports common languages and collects multiple profile types.
- Cloud Profiler consists of the profiling agent, which collects the data, and a console interface on Google Cloud, which lets you view and analyze the data collected by the agent.
- Cloud Profiler is supported for Compute Engine, App Engine, GKE, and applications running on on-premises as well.
- Continuous profiling alleviates the need to develop accurate predictive load tests and benchmarks for the production environment.
Cloud Trace
- Cloud Trace is a distributed tracing system that collects latency data from the applications and displays it in the Google Cloud Console.
- Cloud Trace helps understand how long it takes the application to handle incoming requests from users or applications, and how long it takes to complete operations like RPC calls performed when handling the requests.
- Cloud Trace can track how requests propagate through the application and receive detailed near real-time performance insights.
- Cloud Trace automatically analyzes all of the application’s traces to generate in-depth latency reports to surface performance degradations and can capture traces from all the VMs, containers, or App Engines.
- Cloud Trace supports OTLP span ingestion from applications instrumented with OpenTelemetry.
- Trace data is stored in observability buckets with expanded regional support (40+ regions as of 2026).
Trace Explorer
- The Trace Explorer provides an interactive span duration heatmap, span rate line chart, and span duration percentile chart.
- It allows filtering by service, application, error state, and other properties.
- The Grouped tab shows how many spans different services are generating with latency statistics per service and span name.
- Trace Explorer supports App Hub annotations to identify registered services and workloads.
- It provides a flyout view to explore span attributes, events, and associated log data.
OpenTelemetry Integration
- Google Cloud Observability natively supports OpenTelemetry Protocol (OTLP) for metrics, traces, and logs ingestion.
- The Google-Built OpenTelemetry Collector lets you send correlated OTLP traces, metrics, and logs to Google Cloud Observability from applications instrumented using OpenTelemetry SDKs.
- The Telemetry API (
telemetry.googleapis.com) implements the OpenTelemetry Line Protocol and supports http/protobuf, http/json, and gRPC protocols. - Applications can be instrumented once with OpenTelemetry and deployed on Compute Engine, GKE, or Cloud Run, querying and alerting on data together.
- GKE offers a curated OpenTelemetry ingestion pipeline for simplified setup.
Application Monitoring
- Application Monitoring provides an application-centric approach to monitoring integrated with App Hub.
- It provides pre-curated dashboards with relevant metrics and logs mapped to user-defined applications in App Hub.
- It incorporates best practices from Google SRE for optimized troubleshooting.
- Application Monitoring creates dashboards for App Hub applications, services, and workloads.
- It displays a topology view of the application showing resource interactions.
- App Hub-specific labels let Google Cloud Observability construct the hierarchy of dashboards and filter telemetry data.
Cloud Debugger (Shut Down)
⚠️ SERVICE SHUT DOWN
Cloud Debugger was deprecated on May 16, 2022 and shut down on May 31, 2023.
This content is maintained for historical reference and may still appear on certification exams as a legacy question.
Replacement:
- Snapshot Debugger (Open Source) – An open-source replacement that uses Firebase Realtime Database as the backend. It provides the same snapshot and logpoint functionality. Note: The repository was archived in July 2024.
- Cloud Logging + Error Reporting – Use structured logging and error reporting for production debugging.
- OpenTelemetry tracing – Use distributed tracing for understanding application behavior in production.
- Cloud Debugger allowed inspecting the state of an application at any code location without stopping or slowing down the running app.
- Cloud Debugger made it easier to view the application state without adding logging statements.
- Cloud Debugger added less than 10ms to the request latency only when the application state was captured.
- Cloud Debugger could be used with or without access to the app’s source code.
- Cloud Debugger supported Cloud Source Repositories, GitHub, Bitbucket, or GitLab as the source code repository.
Debug Snapshots
- Debug Snapshots captured local variables and the call stack at a specific line location in the app’s source code without stopping or slowing it down.
- Certain conditions and locations could be specified to return a snapshot of the app’s data.
- Debug Snapshots supported canarying wherein the debugger agent tested the snapshot on a subset of the instances.
Debug Logpoints
- Debug Logpoints allowed injecting logging into running services without restarting or interfering with the normal function of the service.
- Debug Logpoints were useful for debugging production issues without having to add log statements and redeploy.
- Debug Logpoints remained active for 24 hours after creation, or until they were deleted or the service was redeployed.
- If a logpoint was placed on a line that received lots of traffic, the Debugger throttled the logpoint to reduce its impact on the application.
GCP Certification Exam Practice Questions
- Which service provides distributed tracing to help identify latency bottlenecks?
- Cloud Trace
- Which Google Cloud Observability feature allows you to query logs using SQL without exporting to BigQuery?
- Log Analytics
- What happened to Cloud Debugger?
- It was deprecated in May 2022 and shut down in May 2023. The open-source Snapshot Debugger is the replacement.
- Which service allows you to run Prometheus at scale without managing the backend infrastructure?
- Google Cloud Managed Service for Prometheus
- Which protocol does Google Cloud Observability natively support for vendor-agnostic telemetry ingestion?
- OpenTelemetry Protocol (OTLP)
Related Posts
- Google Cloud Bigtable – Use Cases, Performance & When to Choose
- Google Cloud VPC Peering – Setup, Limits & Best Practices
- Google Cloud Storage Classes – Standard, Nearline, Coldline & Archive
- Google Cloud VPN – HA VPN, Classic VPN & Routing Options
- App Engine Standard vs Flexible – Differences & When to Use
- Cloud Interconnect – Dedicated vs Partner, Setup & Pricing
- GCE Storage Options – Persistent Disk vs Local SSD vs Hyperdisk
- Google Cloud Identity – SSO, Directory & Federation Guide
- Container Registry vs Artifact Registry – Differences & Migration
- Google Cloud Load Balancing Types Compared [2026 Guide]
References