Google Cloud Observability – Monitoring & Logging Suite

Google Cloud Observability (formerly Operations Suite)

Google Cloud Observability (formerly known as Google Cloud Operations Suite) provides integrated monitoring, logging, and trace managed services for applications and systems running on Google Cloud and beyond. It is built on a “One Observability” foundation that unifies Cloud Logging, Cloud Monitoring, and Cloud Trace, providing a single pane of glass for the generation, collection, routing, storage, and consumption of telemetry at scale.
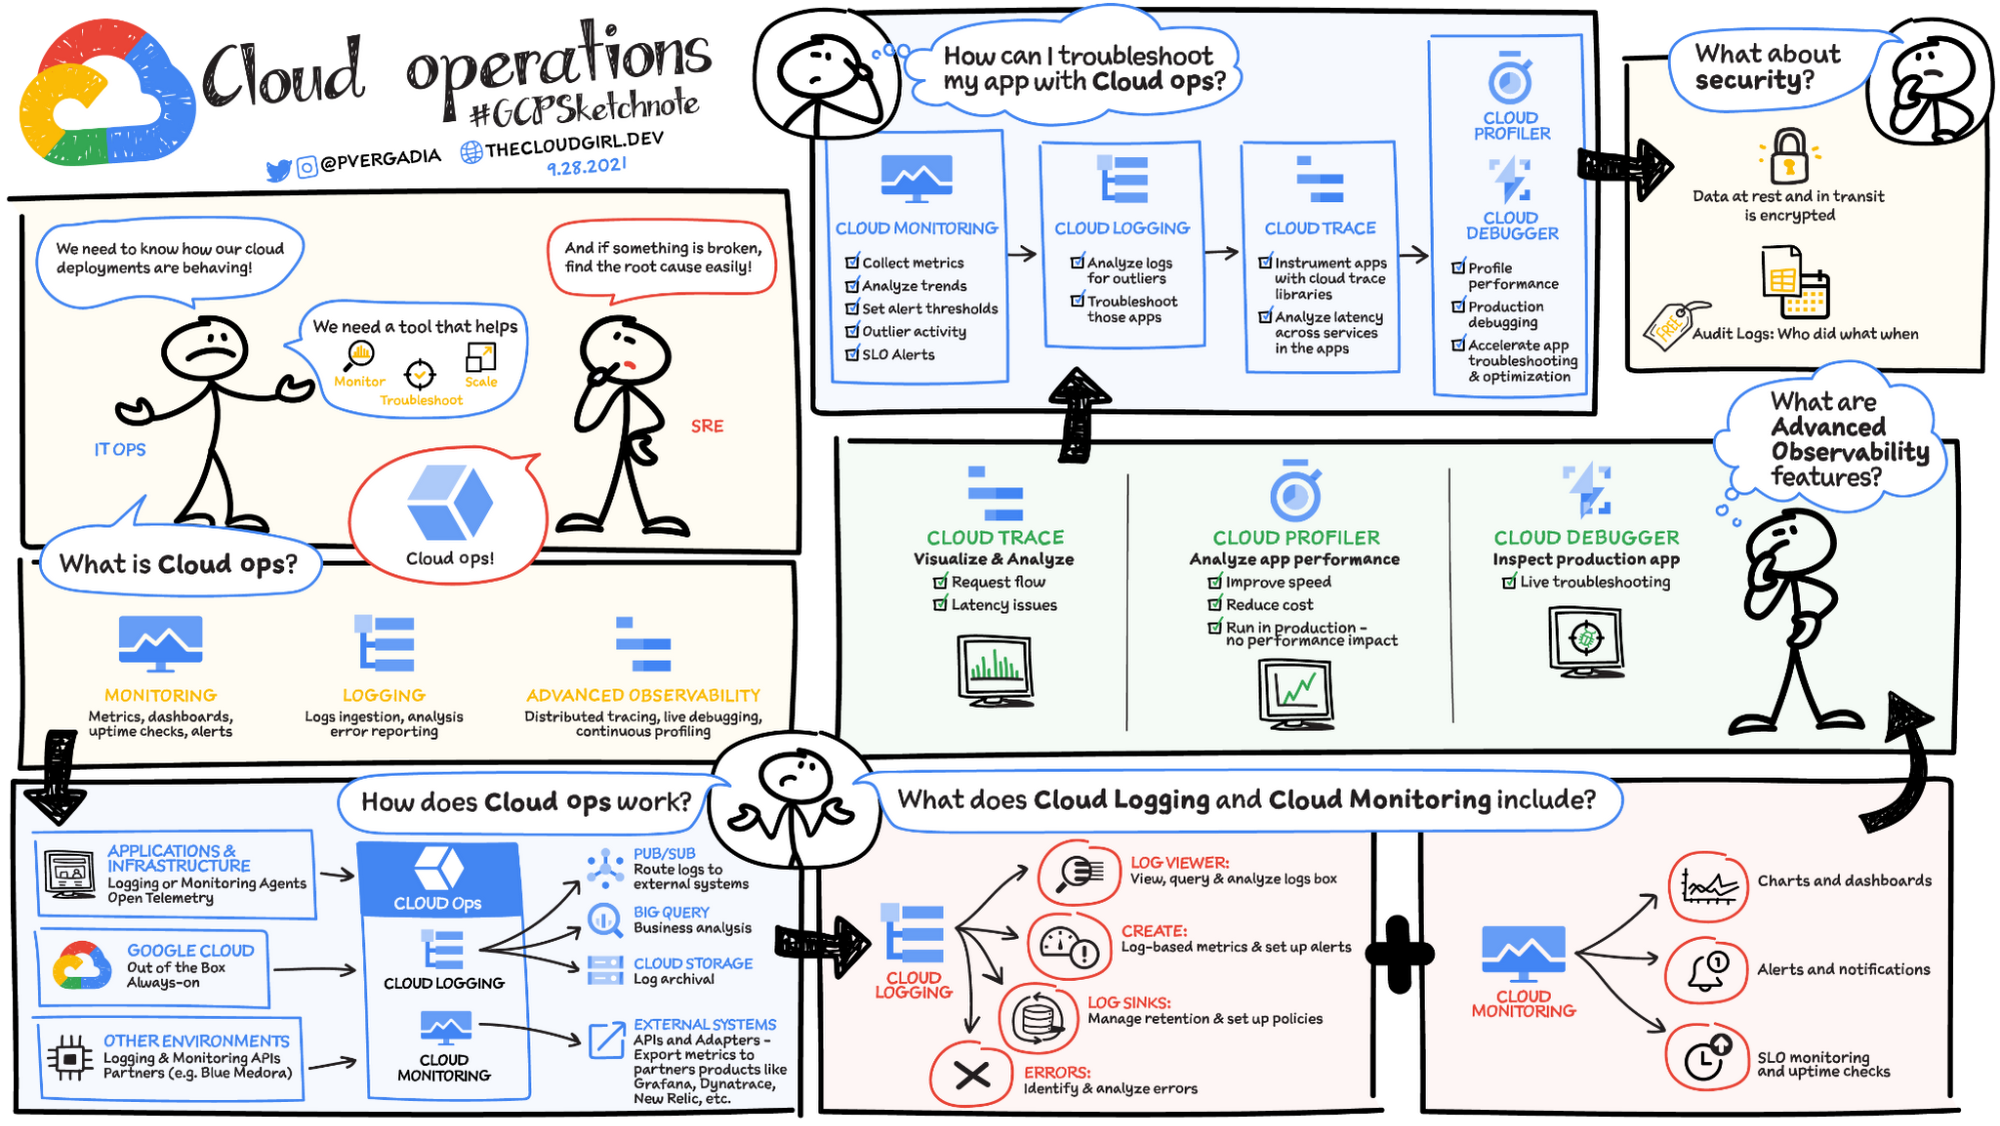
Google Cloud Observability Suite
Credit Priyanka Vergadia

Cloud Monitoring

  • Cloud Monitoring collects measurements of key aspects of the service and of the Google Cloud resources used.
  • Cloud Monitoring provides tools to visualize and monitor this data.
  • Cloud Monitoring helps gain visibility into the performance, availability, and health of the applications and infrastructure.
  • Cloud Monitoring collects metrics, events, and metadata from Google Cloud, AWS, hosted uptime probes, and application instrumentation.
  • Cloud Monitoring supports PromQL (Prometheus Query Language) for querying all metrics, including Google Cloud system metrics, Kubernetes metrics, custom metrics, and log-based metrics.
  • Cloud Monitoring supports SLO Monitoring to define Service Level Objectives, track error budgets, and create alerting policies based on budget burn rate.
  • Cloud Monitoring provides customizable observability dashboards available in GKE, Compute Engine, Cloud Run, Cloud Functions, Cloud Storage, and many other Google Cloud services.

Google Cloud Managed Service for Prometheus

  • Google Cloud Managed Service for Prometheus lets you globally monitor and alert on workloads using Prometheus and OpenTelemetry, without having to manually manage and operate Prometheus at scale.
  • It supports managed collection on GKE, Compute Engine, and Cloud Run.
  • Prometheus metrics can be used with dashboarding, alerting, and SLO monitoring features inside Cloud Monitoring.
  • It supports PromQL-based alerting policies alongside Cloud Monitoring metrics and dashboards.
  • Grafana dashboards work natively with Managed Prometheus for visualization.

Cloud Logging

  • Cloud Logging is a service for storing, viewing and interacting with logs.
  • Answers the questions “Who did what, where and when” within the GCP projects.
  • Maintains non-tamperable audit logs for each project and organization.
  • Logs buckets are a regional resource, which means the infrastructure that stores, indexes, and searches the logs are located in a specific geographical location.
  • Cloud Logging supports OTLP-formatted log ingestion using OpenTelemetry Collector and the Telemetry API.
  • Cloud Logging supports log-based alerting policies to notify when specific messages appear in logs.

Log Analytics

  • Log Analytics (GA since January 2023) brings capabilities to search, aggregate, or transform logs at query time directly within Cloud Logging.
  • Log Analytics is powered by BigQuery, allowing SQL queries on log data without separate exports.
  • Log Analytics supports pipe syntax (available since February 2025) for more intuitive querying.
  • It enables security log analytics for auditing cloud usage and detecting potential threats using Community Security Analytics (CSA) queries.
  • Log Analytics reduces costs and accelerates time to value compared to traditional BigQuery log exports.

Error Reporting

  • Error Reporting aggregates and displays errors produced in the running cloud services.
  • Error Reporting provides a centralized error management interface, to help find the application’s top or new errors so that they can be fixed faster.
  • Error Reporting can analyze log entries routed to log buckets in non-global regions, provided the log sink is in the same project as the log bucket.
  • Error Reporting supports Slack and webhook notifications for error alerts.

Cloud Profiler

  • Cloud Profiler helps with continuous CPU, heap, and other parameters profiling to improve performance and reduce costs.
  • Cloud Profiler is a continuous profiling tool that is designed for applications running on Google Cloud:
    • It’s a statistical, or sampling, profiler that has low overhead and is suitable for production environments.
    • It supports common languages and collects multiple profile types.
  • Cloud Profiler consists of the profiling agent, which collects the data, and a console interface on Google Cloud, which lets you view and analyze the data collected by the agent.
  • Cloud Profiler is supported for Compute Engine, App Engine, GKE, and applications running on on-premises as well.
  • Continuous profiling alleviates the need to develop accurate predictive load tests and benchmarks for the production environment.

Cloud Trace

  • Cloud Trace is a distributed tracing system that collects latency data from the applications and displays it in the Google Cloud Console.
  • Cloud Trace helps understand how long it takes the application to handle incoming requests from users or applications, and how long it takes to complete operations like RPC calls performed when handling the requests.
  • Cloud Trace can track how requests propagate through the application and receive detailed near real-time performance insights.
  • Cloud Trace automatically analyzes all of the application’s traces to generate in-depth latency reports to surface performance degradations and can capture traces from all the VMs, containers, or App Engines.
  • Cloud Trace supports OTLP span ingestion from applications instrumented with OpenTelemetry.
  • Trace data is stored in observability buckets with expanded regional support (40+ regions as of 2026).

Trace Explorer

  • The Trace Explorer provides an interactive span duration heatmap, span rate line chart, and span duration percentile chart.
  • It allows filtering by service, application, error state, and other properties.
  • The Grouped tab shows how many spans different services are generating with latency statistics per service and span name.
  • Trace Explorer supports App Hub annotations to identify registered services and workloads.
  • It provides a flyout view to explore span attributes, events, and associated log data.

OpenTelemetry Integration

  • Google Cloud Observability natively supports OpenTelemetry Protocol (OTLP) for metrics, traces, and logs ingestion.
  • The Google-Built OpenTelemetry Collector lets you send correlated OTLP traces, metrics, and logs to Google Cloud Observability from applications instrumented using OpenTelemetry SDKs.
  • The Telemetry API (telemetry.googleapis.com) implements the OpenTelemetry Line Protocol and supports http/protobuf, http/json, and gRPC protocols.
  • Applications can be instrumented once with OpenTelemetry and deployed on Compute Engine, GKE, or Cloud Run, querying and alerting on data together.
  • GKE offers a curated OpenTelemetry ingestion pipeline for simplified setup.

Application Monitoring

  • Application Monitoring provides an application-centric approach to monitoring integrated with App Hub.
  • It provides pre-curated dashboards with relevant metrics and logs mapped to user-defined applications in App Hub.
  • It incorporates best practices from Google SRE for optimized troubleshooting.
  • Application Monitoring creates dashboards for App Hub applications, services, and workloads.
  • It displays a topology view of the application showing resource interactions.
  • App Hub-specific labels let Google Cloud Observability construct the hierarchy of dashboards and filter telemetry data.

Cloud Debugger (Shut Down)

⚠️ SERVICE SHUT DOWN

Cloud Debugger was deprecated on May 16, 2022 and shut down on May 31, 2023.

This content is maintained for historical reference and may still appear on certification exams as a legacy question.

Replacement:

  • Snapshot Debugger (Open Source) – An open-source replacement that uses Firebase Realtime Database as the backend. It provides the same snapshot and logpoint functionality. Note: The repository was archived in July 2024.
  • Cloud Logging + Error Reporting – Use structured logging and error reporting for production debugging.
  • OpenTelemetry tracing – Use distributed tracing for understanding application behavior in production.
  • Cloud Debugger allowed inspecting the state of an application at any code location without stopping or slowing down the running app.
  • Cloud Debugger made it easier to view the application state without adding logging statements.
  • Cloud Debugger added less than 10ms to the request latency only when the application state was captured.
  • Cloud Debugger could be used with or without access to the app’s source code.
  • Cloud Debugger supported Cloud Source Repositories, GitHub, Bitbucket, or GitLab as the source code repository.

Debug Snapshots

  • Debug Snapshots captured local variables and the call stack at a specific line location in the app’s source code without stopping or slowing it down.
  • Certain conditions and locations could be specified to return a snapshot of the app’s data.
  • Debug Snapshots supported canarying wherein the debugger agent tested the snapshot on a subset of the instances.

Debug Logpoints

  • Debug Logpoints allowed injecting logging into running services without restarting or interfering with the normal function of the service.
  • Debug Logpoints were useful for debugging production issues without having to add log statements and redeploy.
  • Debug Logpoints remained active for 24 hours after creation, or until they were deleted or the service was redeployed.
  • If a logpoint was placed on a line that received lots of traffic, the Debugger throttled the logpoint to reduce its impact on the application.

GCP Certification Exam Practice Questions

  • Which service provides distributed tracing to help identify latency bottlenecks?
    • Cloud Trace
  • Which Google Cloud Observability feature allows you to query logs using SQL without exporting to BigQuery?
    • Log Analytics
  • What happened to Cloud Debugger?
    • It was deprecated in May 2022 and shut down in May 2023. The open-source Snapshot Debugger is the replacement.
  • Which service allows you to run Prometheus at scale without managing the backend infrastructure?
    • Google Cloud Managed Service for Prometheus
  • Which protocol does Google Cloud Observability natively support for vendor-agnostic telemetry ingestion?
    • OpenTelemetry Protocol (OTLP)

Related Posts

References

Google Cloud Logging – Setup, Queries & Best Practices [2026]

Google Cloud Logging

  • Cloud Logging is a fully managed service for storing, searching, analyzing, monitoring, and alerting on log data and events.
  • Answers the questions “Who did what, where and when” within the GCP projects
  • Maintains non-tamperable audit logs for each project and organizations
  • Logs buckets are a regional resource, which means the infrastructure that stores, indexes, and searches the logs are located in a specific geographical location. Google manages that infrastructure so that the applications are available redundantly across the zones within that region.
  • Cloud Logging is scoped by the project.
  • Cloud Logging is integrated with Cloud Monitoring, Error Reporting, and Cloud Trace for end-to-end observability.
  • Previously known as Stackdriver Logging, it is now part of the Google Cloud Observability suite.

Cloud Logging Process

Google Cloud Logging Export

  • For each Google Cloud project, Logging automatically creates two logs buckets: _Required and _Default.
    • _Required bucket
      • holds Admin Activity audit logs, System Event audit logs, and Access Transparency logs
      • retains them for 400 days.
      • the retention period of the logs stored here cannot be modified.
      • aren’t charged for the logs stored in _Required, and
      • cannot delete this bucket.
    • _Default bucket
      • holds all other ingested logs in a Google Cloud project except for the logs held in the _Required bucket.
      • are charged
      • are retained for 30 days, by default, and can be customized from 1 to 3650 days
    • these buckets cannot be deleted
  • All logs generated in the project are stored in the _Required and _Default logs buckets, which live in the project that the logs are generated in
  • Logs buckets only have regional availability, including those created in the global region.
  • User-defined (custom) log buckets can be created for more granular log management
    • Allow custom retention periods (1 to 3650 days)
    • Support CMEK (Customer-Managed Encryption Keys) for encryption
    • Can be upgraded to use Observability Analytics for SQL-based querying
    • Can have linked BigQuery datasets for advanced analytics
    • Cannot be created in folders or organizations

Cloud Logging Types

Cloud Platform Logs

  • Cloud platform logs are service-specific logs that can help troubleshoot and debug issues, as well as better understand the Google Cloud services.
  • Cloud Platform logs are logs generated by GCP services and vary depending on which Google Cloud resources are used in your Google Cloud project or organization.

Security Logs

  • Audit Logs
    • Cloud Audit Logs includes four types of audit logs:
      • Admin Activity,
      • Data Access,
      • System Event, and
      • Policy Denied.
    • Cloud Audit Logs provide audit trails of administrative changes and data accesses of the Google Cloud resources.
      • Admin Activity
        • captures user-initiated resource configuration changes
        • enabled by default
        • no additional charge
        • admin activity – administrative actions and API calls
        • have 400-day retention
      • System Events
        • captures system initiated resource configuration changes
        • enabled by default
        • no additional charge
        • system events – GCE system events like live migration
        • have 400-day retention
      • Data Access logs
        • Log API calls that create, modify or read user-provided data for e.g. object created in a GCS bucket.
        • 30-day retention
        • disabled by default (except BigQuery, which is enabled by default)
        • size can be huge
        • charged beyond free limits
        • Available for GCP-visible services only. Not available for public resources.
      • Policy Denied logs
        • Records when a Google Cloud service denies access to a user or service account because of a security policy violation.
        • Generated by VPC Service Controls, Organization Policies, and other security services when access is denied.
        • Enabled by default
        • Stored in the _Default bucket (30-day retention by default)
        • Can be excluded from ingestion using exclusion filters
        • Log name: cloudaudit.googleapis.com/policy
  • Access Transparency Logs
    • provides logs of actions taken by Google staff when accessing the Google Cloud content.
    • can help track compliance with the organization’s legal and regulatory requirements.
    • have 400-day retention

User Logs

  • User logs are generated by user software, services, or applications and written to Cloud Logging using a logging agent, the Cloud Logging API, or the Cloud Logging client libraries
  • Agent logs
    • produced by logging agent installed that collects logs from user applications and VMs
    • covers log data from third-party applications
    • charged beyond free limits
    • 30-day retention

Cloud Logging Export / Log Router

  • Log entries are stored in logs buckets for a specified length of time i.e. retention period and are then deleted and cannot be recovered
  • The Log Router receives all log entries and routes them through sinks to supported destinations.
  • Logs can be exported by configuring log sinks, which then continue to export log entries as they arrive in Logging.
  • A sink includes a destination and a filter that selects the log entries to export.
  • Exporting involves writing a filter that selects the log entries to be exported, and choosing a destination from the following options:
    • Cloud Storage: JSON files stored in buckets for long term retention
    • BigQuery: Tables created in BigQuery datasets for analytics
    • Pub/Sub: JSON messages delivered to Pub/Sub topics to stream to other resources. Supports third-party integrations, such as Splunk
    • Cloud Logging bucket: Log entries held in another Cloud Logging logs bucket (including in another project).
  • Every time a log entry arrives in a project, folder, billing account, or organization resource, Logging compares the log entry to the sinks in that resource. Each sink whose filter matches the log entry writes a copy of the log entry to the sink’s export destination.
  • Exporting happens for new log entries only, it is not retrospective.
    • However, Batch and Route Retroactively (Copy Logs) feature now allows copying existing logs stored in log buckets to supported destinations retroactively.
  • Exclusion Filters can be added to sinks to exclude matching log entries from being ingested or routed, helping reduce costs.

Aggregated Sinks

  • Aggregated sinks let you route logs from an organization or folder to a supported destination.
  • Can be configured as intercepting or non-intercepting:
    • Intercepting sink: prevents log entries from being routed to sinks in child resources (except _Required sinks). Gives centralized control over log routing.
    • Non-intercepting sink: routes matching log entries to the destination but does not prevent child resource sinks from also routing those entries.
  • Useful for centralized log storage and compliance across organizations.

Observability Analytics (formerly Log Analytics)

  • Observability Analytics lets you search, aggregate, and analyze logs using SQL queries directly in the Cloud Console.
  • Provides a SQL editor and a menu-based system for building queries.
  • Query results can be viewed in tabular form or visualized as charts.
  • Charts can be saved to custom dashboards.
  • Supports querying log views on log buckets and Analytics Views.
  • Analytics Views allow transforming log data from the LogEntry format into a custom schema more suitable for specific use cases.
  • Can also be used to query trace data for correlated observability.
  • Linked BigQuery Datasets:
    • Not required for basic log querying — Observability Analytics handles that directly.
    • Required when you want to: join log data with other BigQuery datasets, query from BigQuery Studio or Looker Studio, or run queries on BigQuery reserved slots for better performance.
  • SQL-based alerting policies can be configured to monitor query results and trigger alerts.
  • Log buckets need to be upgraded to use Observability Analytics.

Log Scopes

  • Log scopes are named collections of log views that span the same or different projects.
  • Control which resources the Logs Explorer searches for log data.
  • Enable multi-project log querying from a single view.
  • Made up of groups of log views that control and grant permissions to a subset of logs in a log bucket.
  • Useful for teams that need access to logs across multiple projects without switching between them.

Log-based Metrics

  • Log-based metrics are based on the content of log entries for e.g., the metrics can record the number of log entries containing particular messages, or they can extract latency information reported in log entries.
  • Log-based metrics can be used in Cloud Monitoring charts and alerting policies.
  • Log-based metrics are of two kinds
    • System-defined log-based metrics
      • provided by Cloud Logging for use by all Google Cloud projects.
      • System log-based metrics are calculated from included logs only i.e. they are calculated only from logs that have been ingested by Logging. If a log has been explicitly excluded from ingestion by Logging, it isn’t included in these metrics.
    • User-defined log-based metric
      • user-created to track things in the Google Cloud project for e.g. a log-based metric to count the no. of log entries that match a given filter.
      • User-defined log-based metrics are calculated from both included and excluded logs. i.e. are calculated from all logs received by the Logging API for the Cloud project, regardless of any inclusion filters or exclusion filters that may apply to the Cloud project.
  • Log-based metrics can be project-scoped or bucket-scoped:
    • Project-scoped: apply to a single Google Cloud project (traditional behavior)
    • Bucket-scoped: created on a specific log bucket, allowing metrics on logs from multiple projects stored in one bucket
  • Log-based metrics support the following types
    • Counter metrics count the number of log entries matching a given filter.
    • Distribution metrics accumulate numeric data from log entries matching a filter.

Cloud Logging Agent / Ops Agent

⚠️ Legacy Logging Agent Deprecated: The legacy Cloud Logging Agent (fluentd-based) is deprecated. While still supported, Google recommends against using it for new workloads. Use the Ops Agent for all new deployments and plan migration for existing VMs.

Ops Agent (Recommended)

  • The Ops Agent is the recommended agent for collecting logs and metrics from Compute Engine VMs.
  • Sends logs to Cloud Logging and metrics to Cloud Monitoring from a single unified agent.
  • Built on Fluent Bit (for logs) and the OpenTelemetry Collector (for metrics), providing better performance and resource efficiency.
  • Features:
    • Simple, unified YAML-based configuration
    • Support for standard Linux and Windows distros
    • Proxy support
    • OTLP receiver for collecting OpenTelemetry metrics, traces, and logs from instrumented applications
    • Supports 40+ third-party application integrations (Apache, MySQL, PostgreSQL, MongoDB, Nginx, etc.)
    • High throughput with efficient resource management
  • Telemetry API (Preview, May 2026): Starting with Ops Agent v2.66.0, logs and metrics can be exported using the OpenTelemetry-based Telemetry API instead of the proprietary Cloud Logging API and Cloud Monitoring API.
  • OTLP Log Ingestion (April 2026): OTLP-formatted logs can now be ingested into Cloud Logging using an OpenTelemetry Collector, an OTLP exporter, and the Telemetry API.
  • Can be installed on individual VMs, via VM Extension Manager policies, or via agent policies on a fleet of VMs.

Legacy Logging Agent (Deprecated)

  • Cloud Logging Agent streams logs from VM instances and from selected third-party software packages to Cloud Logging.
  • Helps capture logs from GCE and AWS EC2 instances.
  • VM images for GCE and Amazon EC2 don’t include the Logging agent and must be installed explicitly.
  • Uses fluentd for capturing logs.
  • No new feature development or support for new operating systems.
  • The legacy installation script (install-logging-agent.sh) is deprecated.
  • Migration to Ops Agent is recommended for all existing workloads.

Cloud Logging MCP Server (GA – April 2026)

  • The Cloud Logging API MCP (Model Context Protocol) server allows AI agents and LLM-powered applications to interact with log entries programmatically.
  • Enabled automatically when the Cloud Logging API is enabled in a project.
  • Standardizes how large language models connect to Cloud Logging as an external data source.
  • Supports enterprise-grade security through Cloud IAM and is integrated with Cloud Audit Logs for monitoring agent activity.
  • Useful for AI-powered troubleshooting, automated incident response, and log analysis workflows.

Abuse Event Logging (January 2025)

  • Google Cloud customers can track Cloud Abuse Events using Cloud Logging.
  • Events include:
    • Leaked service account keys
    • Crypto mining incidents
    • Malware detection
  • Enables automated incident remediation through integration with Security Command Center and Cloud Functions.
  • Helps organizations detect and respond to security threats faster.

Cloud Logging IAM Roles

  • Logs Viewer (roles/logging.viewer) – View logs except Data Access/Access Transparency logs
  • Private Logs Viewer (roles/logging.privateLogViewer) – View all logs including Data Access logs
  • Logging Admin (roles/logging.admin) – Full access to all logging actions
  • Logs Writer (roles/logging.logWriter) – Write log entries
  • Logs Bucket Writer (roles/logging.bucketWriter) – Write logs to a specific bucket
  • Project Viewer – View logs except Data Access/Access Transparency logs
  • Project Editor – Write, view, and delete logs. Create log based metrics. However, it cannot create export sinks or view Data Access/Access Transparency logs.
  • Project Owner – Full access to all logging actions

GCP Certification Exam Practice Questions

  • Questions are collected from Internet and the answers are marked as per my knowledge and understanding (which might differ with yours).
  • GCP services are updated everyday and both the answers and questions might be outdated soon, so research accordingly.
  • GCP exam questions are not updated to keep up the pace with GCP updates, so even if the underlying feature has changed the question might not be updated
  • Open to further feedback, discussion and correction.
  1. Your organization is a financial company that needs to store audit log files for 3 years. Your organization has hundreds of Google Cloud projects. You need to implement a cost-effective approach for log file retention. What should you do?
    1. Create an export to the sink that saves logs from Cloud Audit to BigQuery.
    2. Create an export to the sink that saves logs from Cloud Audit to a Coldline Storage bucket.
    3. Write a custom script that uses logging API to copy the logs from Cloud Logging to BigQuery.
    4. Export these logs to Cloud Pub/Sub and write a Dataflow pipeline to store logs to Cloud SQL.
  2. A company needs to analyze Cloud Logging data to detect security threats across 50 projects. They want to use SQL queries and visualize the results in dashboards. What approach should they use?
    1. Export logs from all projects to BigQuery using individual sinks per project.
    2. Create an aggregated sink to route logs to a central log bucket, upgrade to Observability Analytics, and use SQL queries with dashboard charts.
    3. Use the Logging API to programmatically read logs from each project.
    4. Create log-based metrics in each project and use Cloud Monitoring dashboards.
  3. Your security team wants to be alerted when VPC Service Controls denies access to resources. Which type of audit log should they monitor?
    1. Admin Activity audit logs
    2. Data Access audit logs
    3. System Event audit logs
    4. Policy Denied audit logs
  4. You are deploying a new application on Compute Engine and need to collect application logs and system metrics. Which agent should you install?
    1. Legacy Cloud Logging Agent
    2. Legacy Cloud Monitoring Agent
    3. Ops Agent
    4. OpenTelemetry Collector only
  5. Your organization needs to centrally control log routing and prevent individual projects from routing certain logs to their own destinations. What should you configure?
    1. Exclusion filters on each project’s _Default sink
    2. Organization policy constraints on logging
    3. An intercepting aggregated sink at the organization level
    4. A non-intercepting aggregated sink at the folder level
  6. A company wants to query log data from Cloud Logging using BigQuery Studio and join it with data from other BigQuery datasets. What do they need to configure?
    1. Export logs to BigQuery using a sink
    2. Use Observability Analytics SQL queries directly
    3. Upgrade the log bucket to use Observability Analytics and create a linked BigQuery dataset
    4. Create a scheduled query in BigQuery to import logs
  7. Which of the following statements about Cloud Audit Logs are correct? (Choose 2)
    1. Admin Activity and System Event logs are enabled by default and cannot be disabled.
    2. Data Access logs are enabled by default for all services.
    3. Policy Denied logs record when access is denied due to VPC Service Controls or Organization Policies.
    4. All audit log types are stored in the _Required bucket with 400-day retention.

Reference